

Flow, cycle time and forecasting
How long tickets take, where they get stuck, and when the remaining work is likely to finish.
This page covers the cards on the Analytics page that describe how work flows through your project's statuses: cycle time, lead time, delivery forecasting, work-in-progress, and bottlenecks. Open a project's Analytics page and scroll past Workload to find them.
None of the cards on this page are scoped by the top-of-page date-range picker. Each uses its own fixed lookback window, noted per card below - that is a deliberate difference from Overview, Velocity, Cycle time, Workload, Loaded member cost and Collaboration, which the range picker does affect (see the scoping table on the main Analytics page).
Cycle time (legacy)
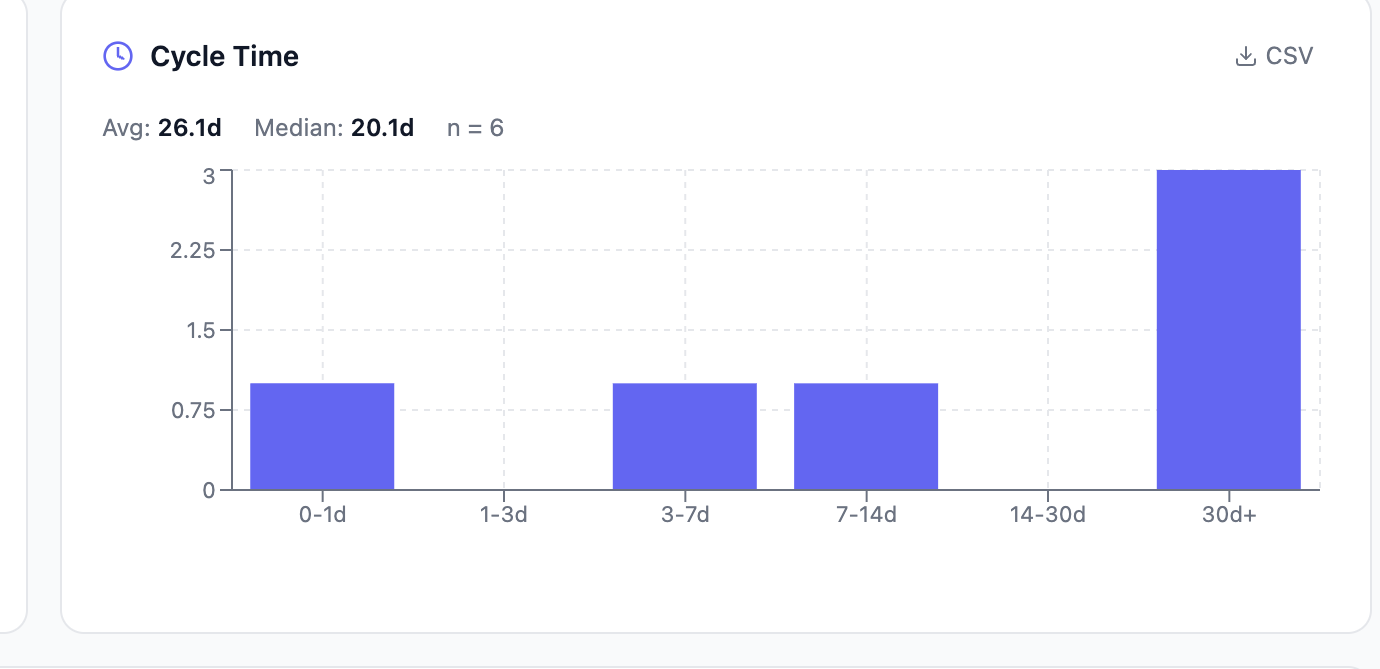
The average and median number of days from a ticket's creation to
its close, plus a histogram of how many tickets fell into each duration
bucket (0-1 day, 1-3, 3-7, 7-14, 14-30, 30+ days). WONT_FIX tickets are
excluded - their "duration" measures how long until someone gave up, not how
long until something shipped.
Unlike the other cards on this page, this one is scoped by the date-range picker on the main Analytics page - it only counts tickets closed inside the selected range. That is why this card's average can disagree with the median lead/cycle time shown in Flow & lead time below, which always looks at the project's whole history.
How to read it: prefer the median over the average - a handful of very old or very slow tickets can drag the average up while most work actually finishes quickly. A wide, flat histogram (tickets spread across every bucket) means delivery time is unpredictable; a histogram bunched in one or two buckets means it's consistent.
Flow & lead time

Three different timings, shown side by side so they're never confused with each other:
- Lead time - created to done. Includes time spent waiting in a queue before anyone touched it.
- Cycle time - first moved to "in progress" to done. Excludes the queue wait; measures active handling only.
- Effort - actual tracked time logged on the ticket (hours), not a calendar span at all.
Each is shown as median (p90) - the typical value, with the 90th percentile in parentheses so you can see the long tail without it being hidden by an average. Rows split the same tickets by group (overall, and by who did the work: agent / human / mixed), by size (an estimate-size bucket: none, XS, S, M, L, XL) and by type (ticket type). A cell that reads "-" means that group has no sample.
This card always looks at the project's entire history (not the date-range picker) and, by default, excludes "degenerate one-shot" tickets - ones created and closed essentially instantly with zero tracked effort, which are almost always a backfill or an import artifact rather than real work, and would otherwise pull cycle time toward zero. The excluded count is shown so the sample size stays honest. Tickets that reached done but never had any of the timeline data this card needs are also counted separately as untracked, not silently dropped.
Delivery forecast

Answers "when will the remaining work realistically be done?" - not with one false-precise date, but with a Monte-Carlo simulation: orboto looks at how many tickets your team actually closed per week over roughly the last 12 weeks, then simulates finishing the remaining tickets thousands of times by repeatedly drawing a random week's throughput from that history. The result is a distribution of "how many weeks did it take" across all those simulated runs.
Three bands are reported:
- p50 - the median simulated run. Half of the simulations finished by this date. Read this as "the most likely date", not a safe commitment.
- p85 - 85% of simulated runs finished by this date. A more conservative number to actually promise a stakeholder.
- p95 - 95% of simulated runs finished by this date. The number to use when being late is expensive.
Remaining work defaults to the open tickets in the currently selected milestone (from the Burndown card's milestone dropdown), or the whole project's open backlog when no milestone is selected.
Why throughput, not cycle time: "how long until N tickets are done" is a question about flow rate, not about any single ticket's calendar duration. A Monte-Carlo simulation over historical throughput captures the week-to-week variance that a single "average cycle time × ticket count" estimate would hide.
If there isn't enough history yet - fewer than 3 tickets completed in the lookback window - the card tells you so directly instead of guessing: "Not enough completed-work history to forecast yet."
Flow metrics
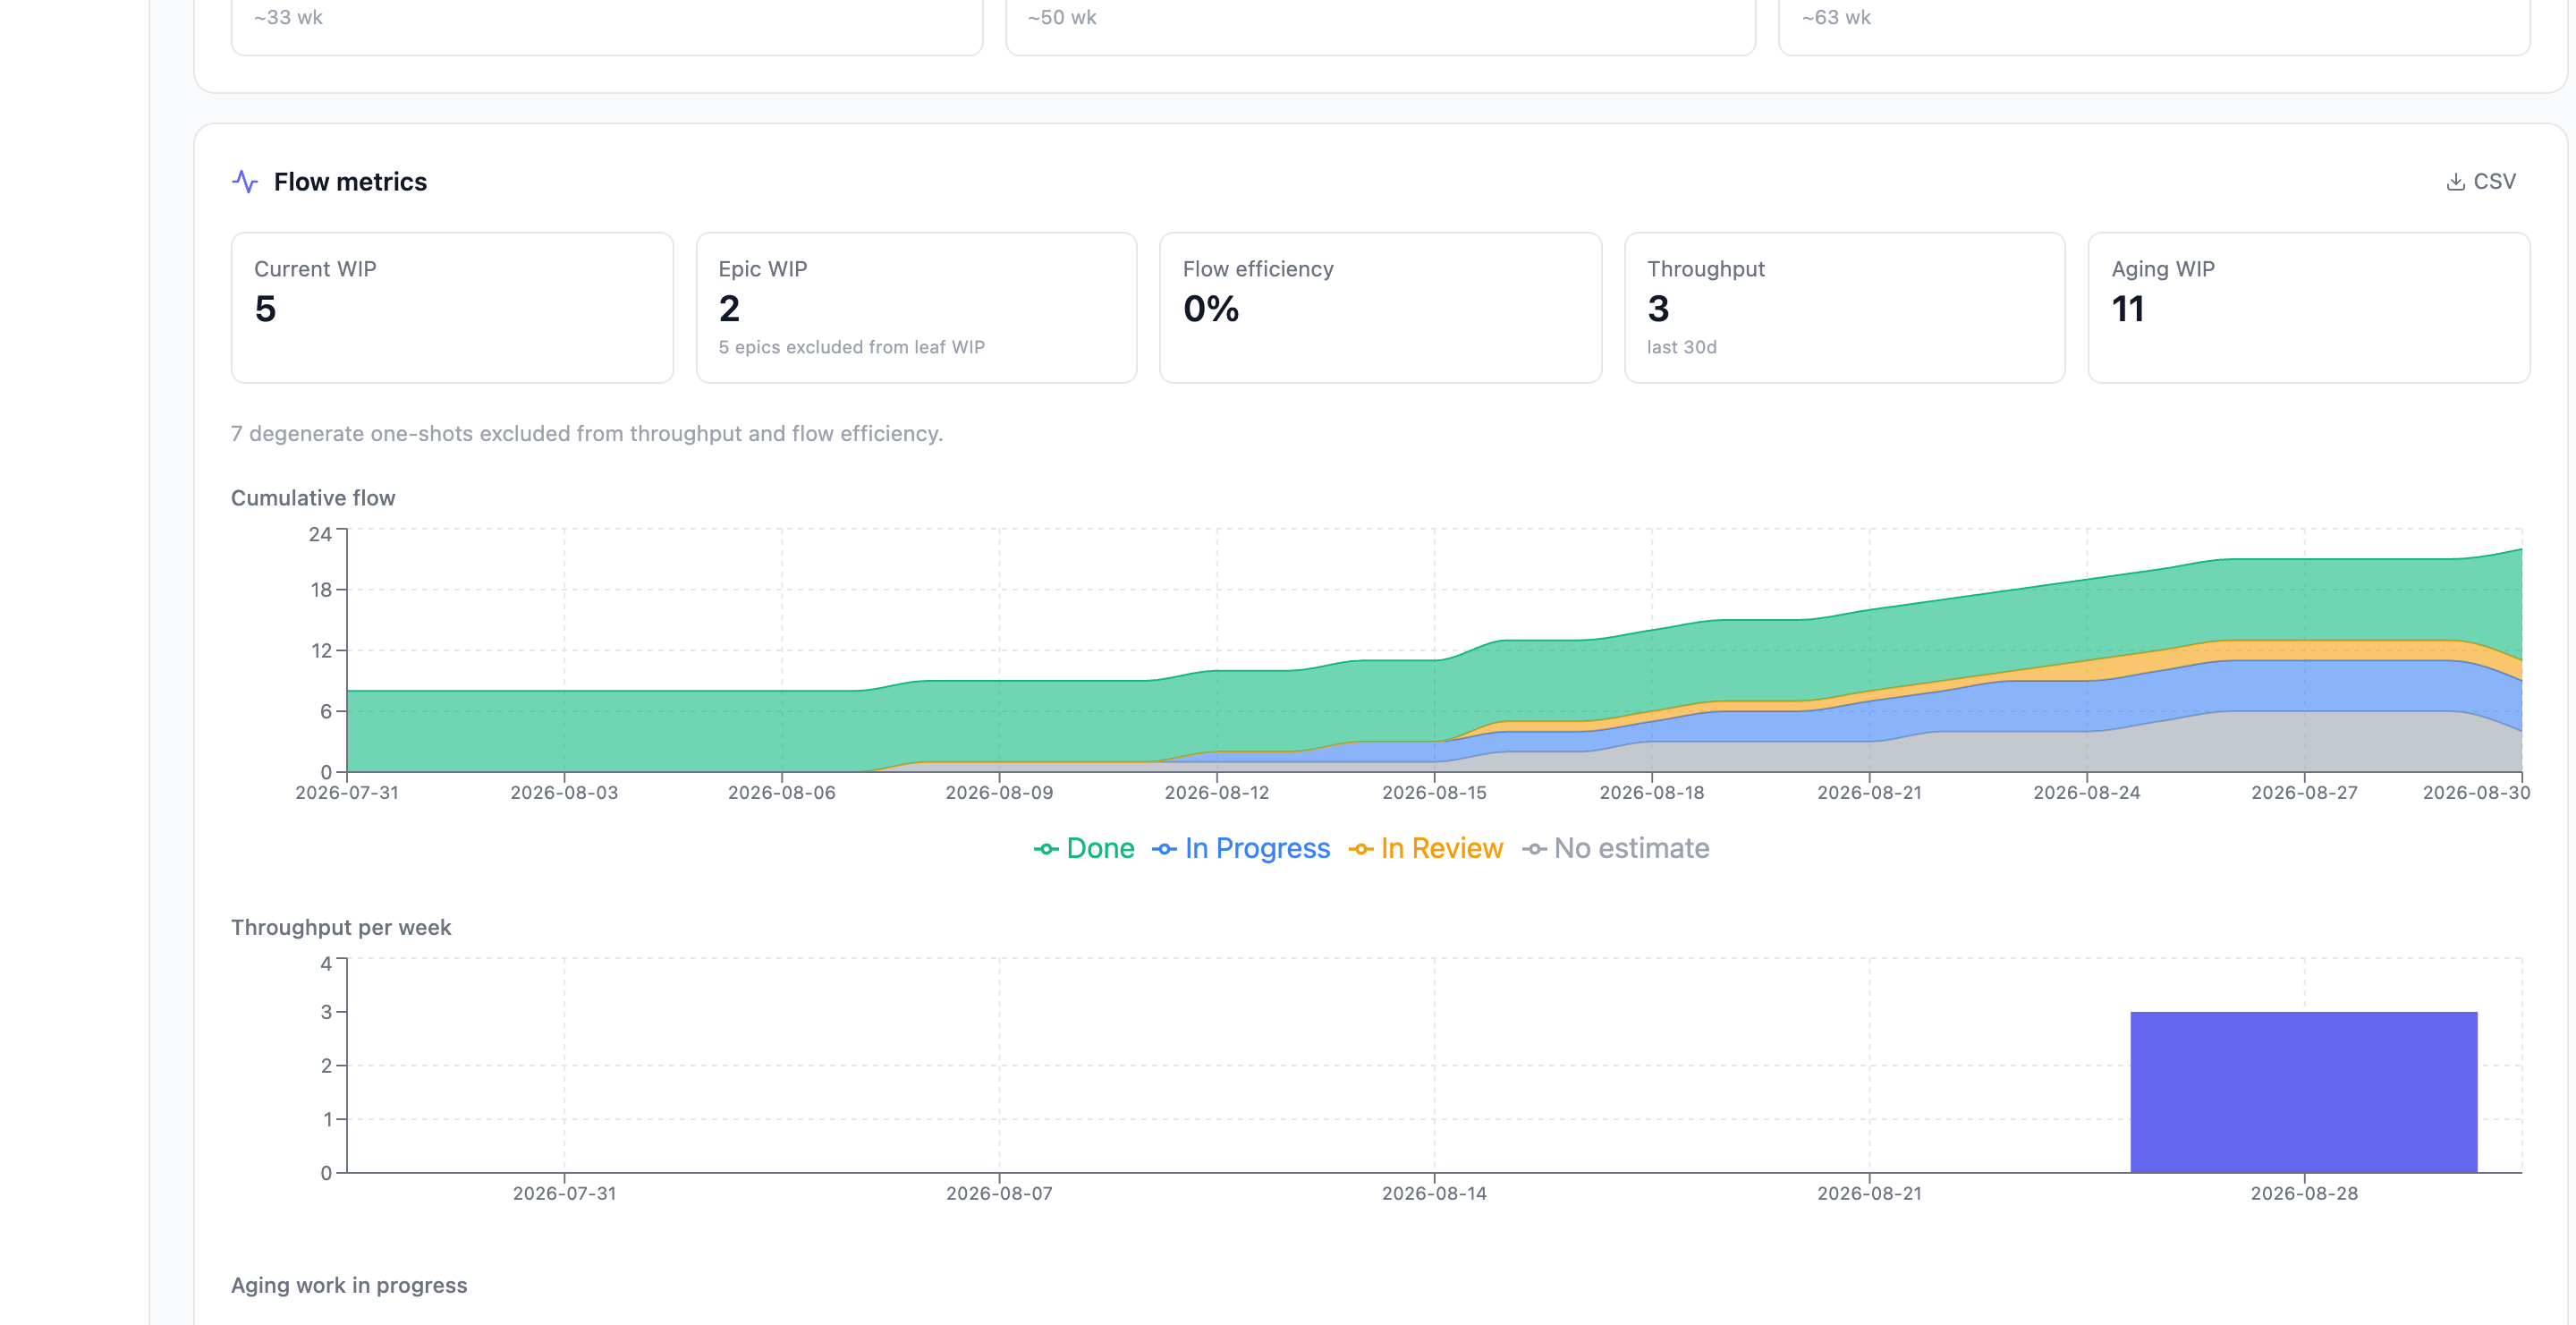
A Kanban-style read on the last 30 days:
- Current WIP - leaf tickets (not epics) currently in progress or in review. This is "how much is actually being worked on right now."
- Epic WIP - epics currently in progress or in review, counted separately so a long-running phase epic doesn't inflate the leaf-work number above.
- Flow efficiency - across completed tickets, the median share of a ticket's total lead time that was spent actively being worked (in progress or in review) versus just waiting. A ticket with 20% flow efficiency spent four-fifths of its life sitting in a queue.
- Throughput - tickets completed in the window (also charted per week below).
- Aging WIP - the count of currently open tickets tracked in the aging table further down.
Below the tiles:
- Cumulative flow diagram (CFD) - a stacked area chart, one band per status category (To Do / In Progress / In Review / Done), showing how many tickets sat in each on each day. Widening bands reveal bottlenecks: if the In Review band keeps getting thicker while In Progress stays thin, review is where work is piling up, not development.
- Throughput per week - the same completed-per-week count as the CFD's Done growth, as a bar chart.
- Aging work in progress - open tickets ranked by how long they've sat in their current status, with their total age alongside. Use this to find tickets that have quietly stalled.
Degenerate one-shot tickets (see Flow & lead time above) are excluded from throughput and flow efficiency here too, with the excluded count shown.
Bottleneck & predictability
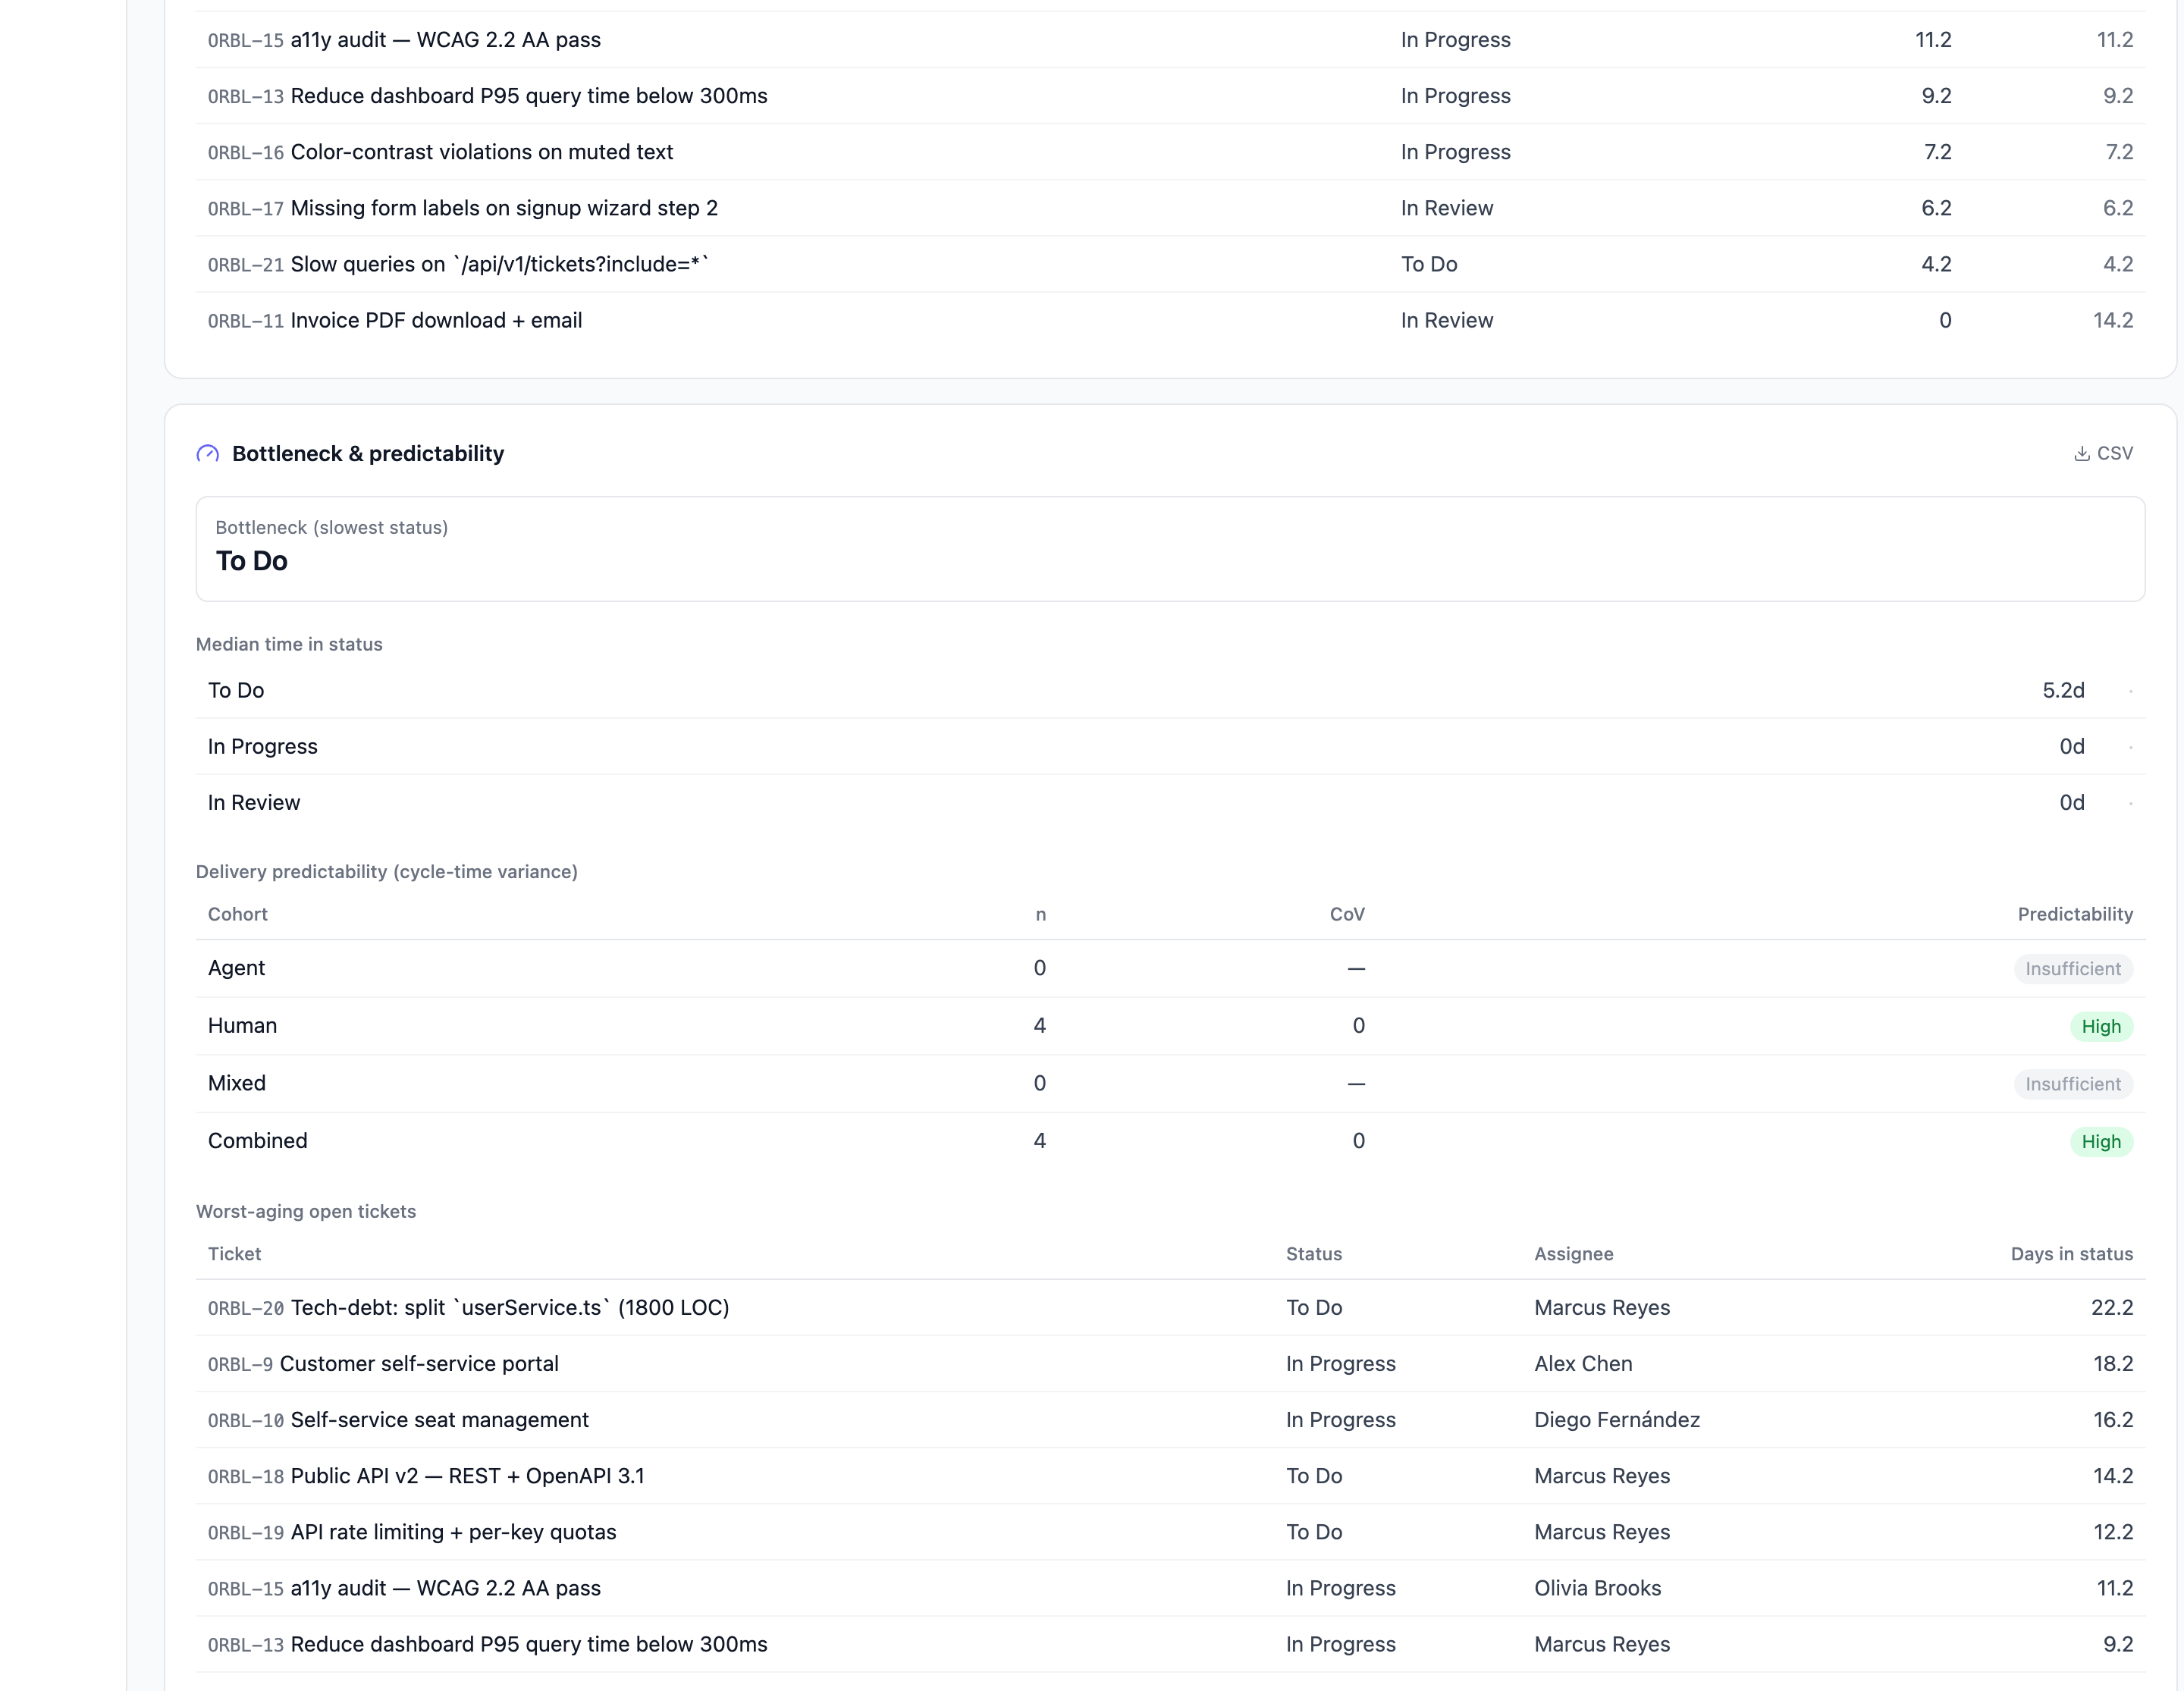
Looks at the last 90 days:
- Bottleneck (slowest status) - the status category with the longest median dwell time across completed tickets - literally, where work spends the most time sitting before moving on.
- Median time in status, per category, with a trend arrow: an upward red arrow means dwell in that status has gotten worse recently versus earlier in the window (more than 15% slower); a downward green arrow means it's improved; a flat dash means no meaningful change.
- Delivery predictability - how consistent completed tickets' cycle time is, per cohort (agent-only / human-only / mixed / combined), using the coefficient of variation (standard deviation divided by the mean). A low coefficient means most tickets take a similar amount of time; a high one means duration is all over the place even if the average looks fine. Ratings: High (coefficient under 0.5) - trustworthy, plan around it confidently. Medium (under 1.0) - usable, but pad your estimates. Low (1.0 or above) - risky; don't promise a date off this cohort's average. Insufficient - fewer than 3 completed tickets in the cohort, too little signal to rate at all.
- Worst-aging open tickets - the open tickets that have sat longest in their current status, with their assignee, so you know who to check in with.
Predictability pairs with Estimation accuracy: accuracy tells you how far off your estimates tend to run; predictability tells you how consistent that gap is.
Troubleshooting
- "No flow data yet" / "No completed tickets with usable timing yet." These cards need completed tickets with real status-transition history. A brand-new project, or one whose tickets were all imported already-closed without transition timestamps, won't have anything to show yet.
- Sample sizes look smaller than the ticket count I'd expect. Degenerate one-shot tickets (instant create-to-close, zero tracked effort) are excluded from cycle time distributions - the excluded count is shown next to the table so you can see how many were dropped and why. Untracked tickets (missing timeline data entirely) are counted separately, not silently folded into the sample. This exclusion behaves the same way for the whole page (Flow & lead time, Flow metrics, Bottleneck): the same denominator logic runs everywhere.
- The forecast says "insufficient" / won't show dates. Fewer than 3 tickets completed inside the lookback window (about the last 12 weeks by default). Wait for more throughput history, or extend the window via the API/agent tools if you need a longer look-back.
- Cycle time (legacy card) and Flow & lead time disagree. Expected - the legacy Cycle time card is scoped by the date-range picker and reports a mean; Flow & lead time always looks at full project history and reports a median. They are answering related but different questions.