

Estimation, collaboration and activity
How accurate your estimates run, how humans and agents split the work, and recent git activity.
This page covers three more cards on the project's Analytics page - Estimation accuracy, Human + agent collaboration, and Git activity - plus the Summarize project button. Scroll to the bottom half of the page to find them.
Estimation accuracy

Scores how your estimates compare to what actually happened, across every completed ticket in the project's history (not scoped by the date-range picker), and turns that into a correction multiplier you can apply to future estimates.
Worked example: say your team estimated a ticket at 5 hours, and it actually took 7 hours. That ticket's ratio is 7 / 5 = 1.4. Across many tickets, orboto takes the median ratio (robust to one wildly-off ticket skewing an average) and calls it the cohort's multiplier. A multiplier of 1.4x means: when you estimate a new ticket at 5 hours, plan for roughly 5 × 1.4 = 7 hours in practice.
- Multiplier above 1 - work tends to run longer than estimated (the common case). Below 1 - estimates tend to run high (padding baked in). Around 1 - estimates are well calibrated already.
- Rows split by cohort: agent-only, human-only, mixed, and combined (all completed tickets together) - so you can see whether agents and humans have different estimation blind spots.
- Confidence reflects sample size, not accuracy: Insufficient (no usable samples), Low (1-4), Medium (5-14), High (15 or more). A high multiplier shown with low confidence is a hint, not a rule to apply yet.
Where the "actual" side of the ratio comes from - orboto prefers the most trustworthy signal available per ticket and falls back gracefully, so older tickets with less tracked data still contribute something rather than being dropped: tracked effort (logged time) first, then cycle time (first "in progress" to done) if nothing was logged, then lead time (created to done) as a last resort. Tickets with no usable signal at all - closed with zero logged time, no status-transition history, and effectively instant - count separately as "untracked" rather than distorting the ratio.
Human + agent collaboration
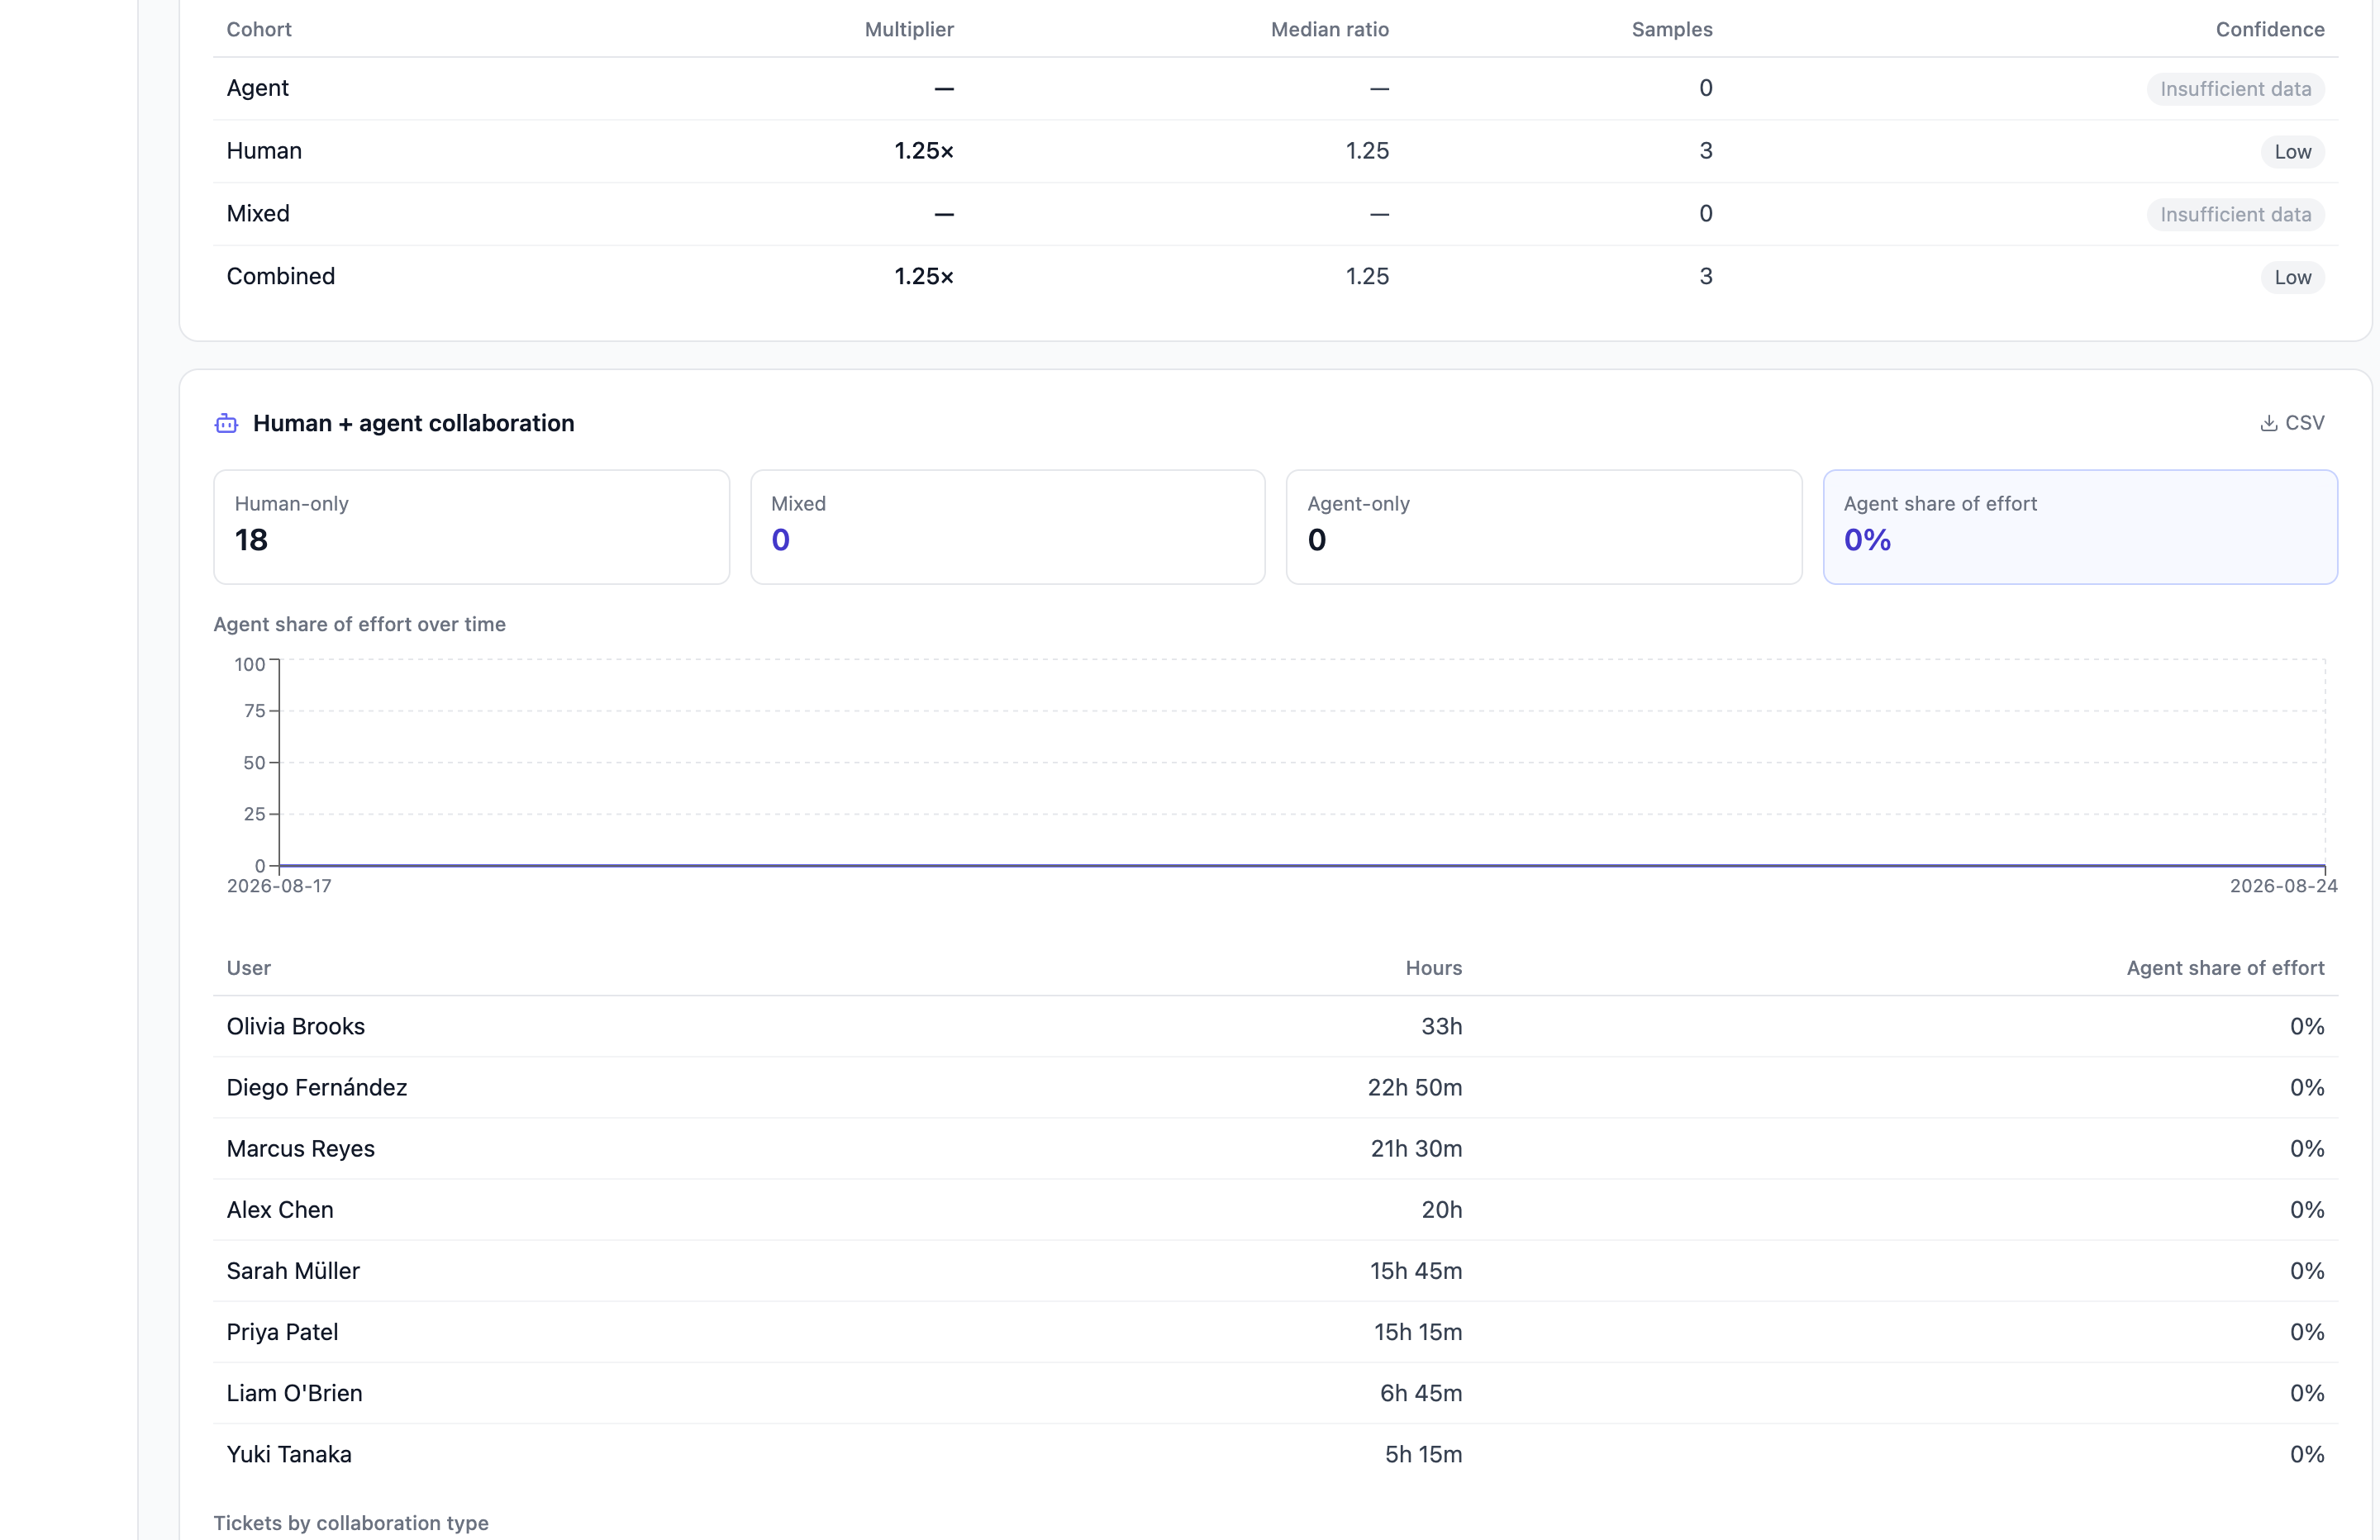
Classifies every ticket that had activity (a time entry, a comment, or a tracked status change) as human-only, agent-only, or mixed, based on who actually did the work - not who is assigned. A ticket driven entirely by an AI agent's comments and commits, with a human only assigned to it on paper, still counts as agent-only here.
- Agent share of effort - agent-logged minutes divided by all logged minutes, shown as a percentage, both as a headline figure and as a week-by-week trend line so you can see whether agent involvement is growing.
- Per-member table - each person's (or bot account's) total logged hours and their own agent-share percentage.
- Tickets by collaboration type - a drill-down list of the most recent agent-involved tickets with their classification badge.
This card is scoped by both the date-range picker and the milestone selector inside the Burndown card above - a milestone picked there narrows this card to that milestone's tickets too.
Git activity
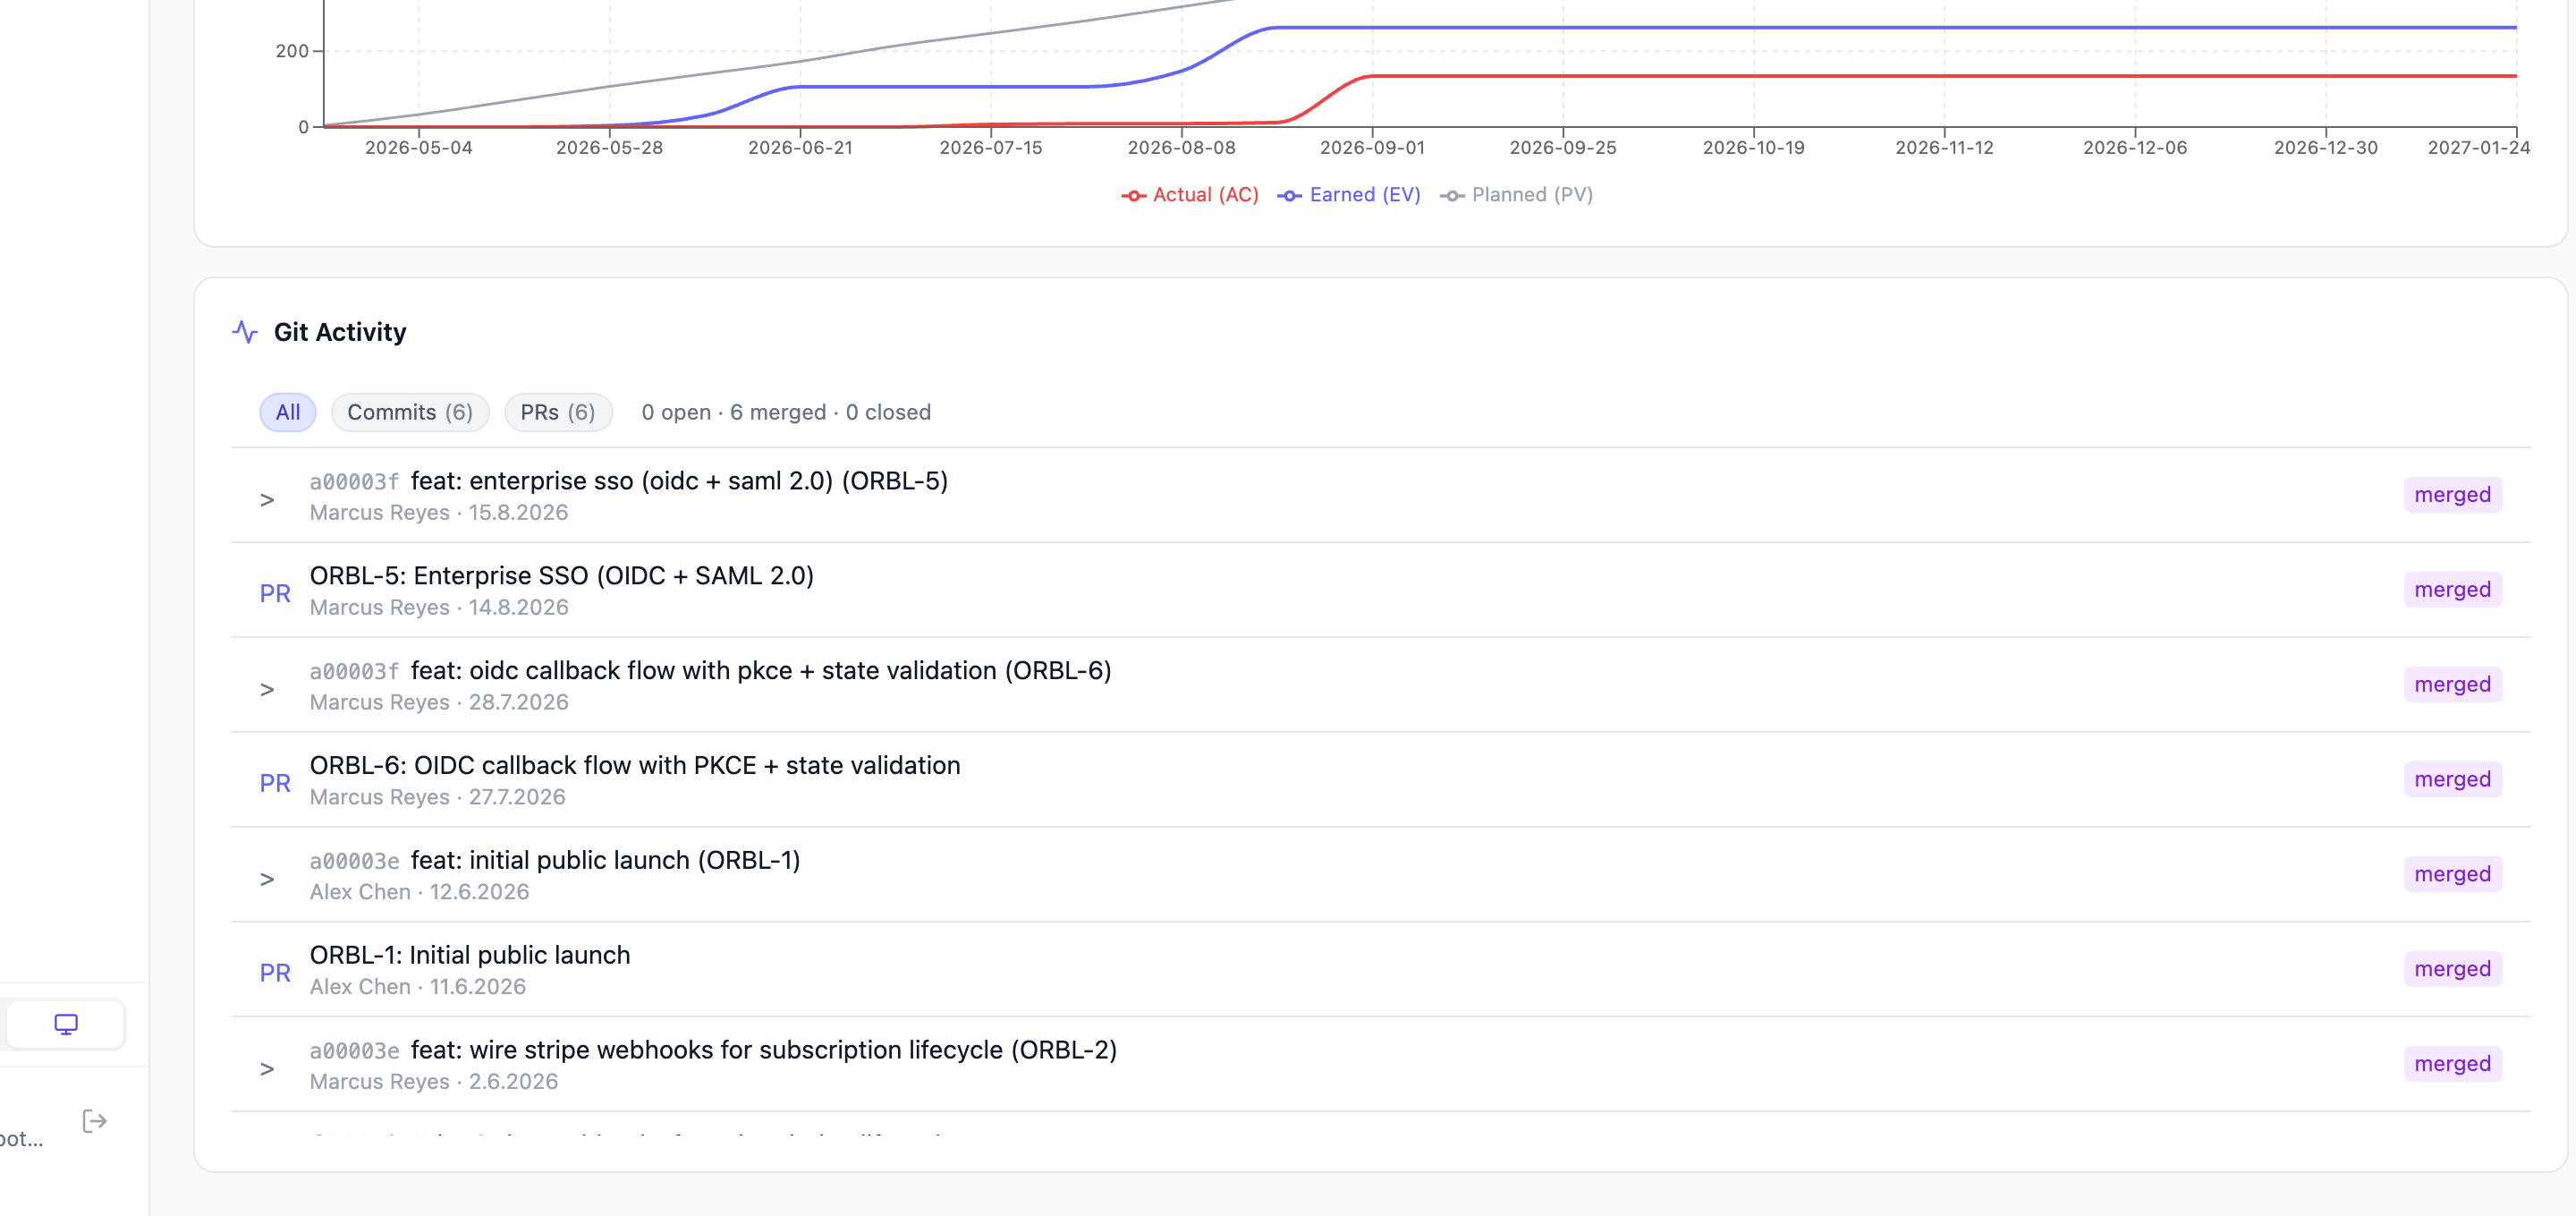
A combined, filterable feed of commits and pull requests linked to this project through a connected git integration, at the very bottom of the Analytics page. Filter chips switch between All / Commits / PRs, and the PR chip shows an open/merged/closed breakdown. "Load more" fetches further back in batches of 20. The card is hidden entirely if the project has no git activity at all under the "All" filter - there's nothing to show yet rather than an empty box.
This requires a connected repository; setting that up is a separate topic from analytics.
Summarize project (AI)
The sparkle-icon Summarize project button in the page header (only visible when your workspace has AI configured) asks the assistant to write a short, current-state paragraph about the project on demand - a quick narrative complement to the charts, not a replacement for them. See AI assistant for what it draws on.
Troubleshooting
- Estimation accuracy shows "-" or "Insufficient" everywhere. The project doesn't have enough completed tickets with a usable actual-versus- estimate signal yet. This needs completed tickets that were also estimated - an unestimated ticket contributes nothing to its ratio.
- "No human or agent activity in this range yet." Either nothing has happened in the selected date range, or (if you narrowed by milestone) that milestone has no activity. Widen the range or clear the milestone filter.
- The collaboration numbers look different after switching milestones. Expected - the milestone selector on the Burndown card also scopes this card, even though it isn't visually next to it. See the scoping note on the main Analytics page.
- Git activity panel is missing entirely. Either the project has no connected git repository, or it has one but there's genuinely no commit or PR history recorded yet.