

MCP setup and usage
The admin side of the Model Context Protocol server: onboarding, the usage dashboard, per-call logging, and the workspace kill switch.
This page covers the admin surfaces around orboto's MCP server: onboarding another user, watching how much MCP traffic your workspace generates, drilling into individual calls, and switching MCP off workspace-wide if you ever need to. For how to connect a specific AI client (Claude Desktop, Cursor, Copilot, Codex) yourself, see MCP server setup - this page is about administering the surface other people connect to, not connecting your own client.
What MCP is, in one sentence
The Model Context Protocol is a standard way for AI clients to call structured tools against an external system. orboto ships an MCP server so any MCP-aware AI client can read and modify tickets, docs, milestones, and timers as a regular orboto user - every call is authenticated and permission-checked exactly as if that user had made the equivalent REST API call themselves.
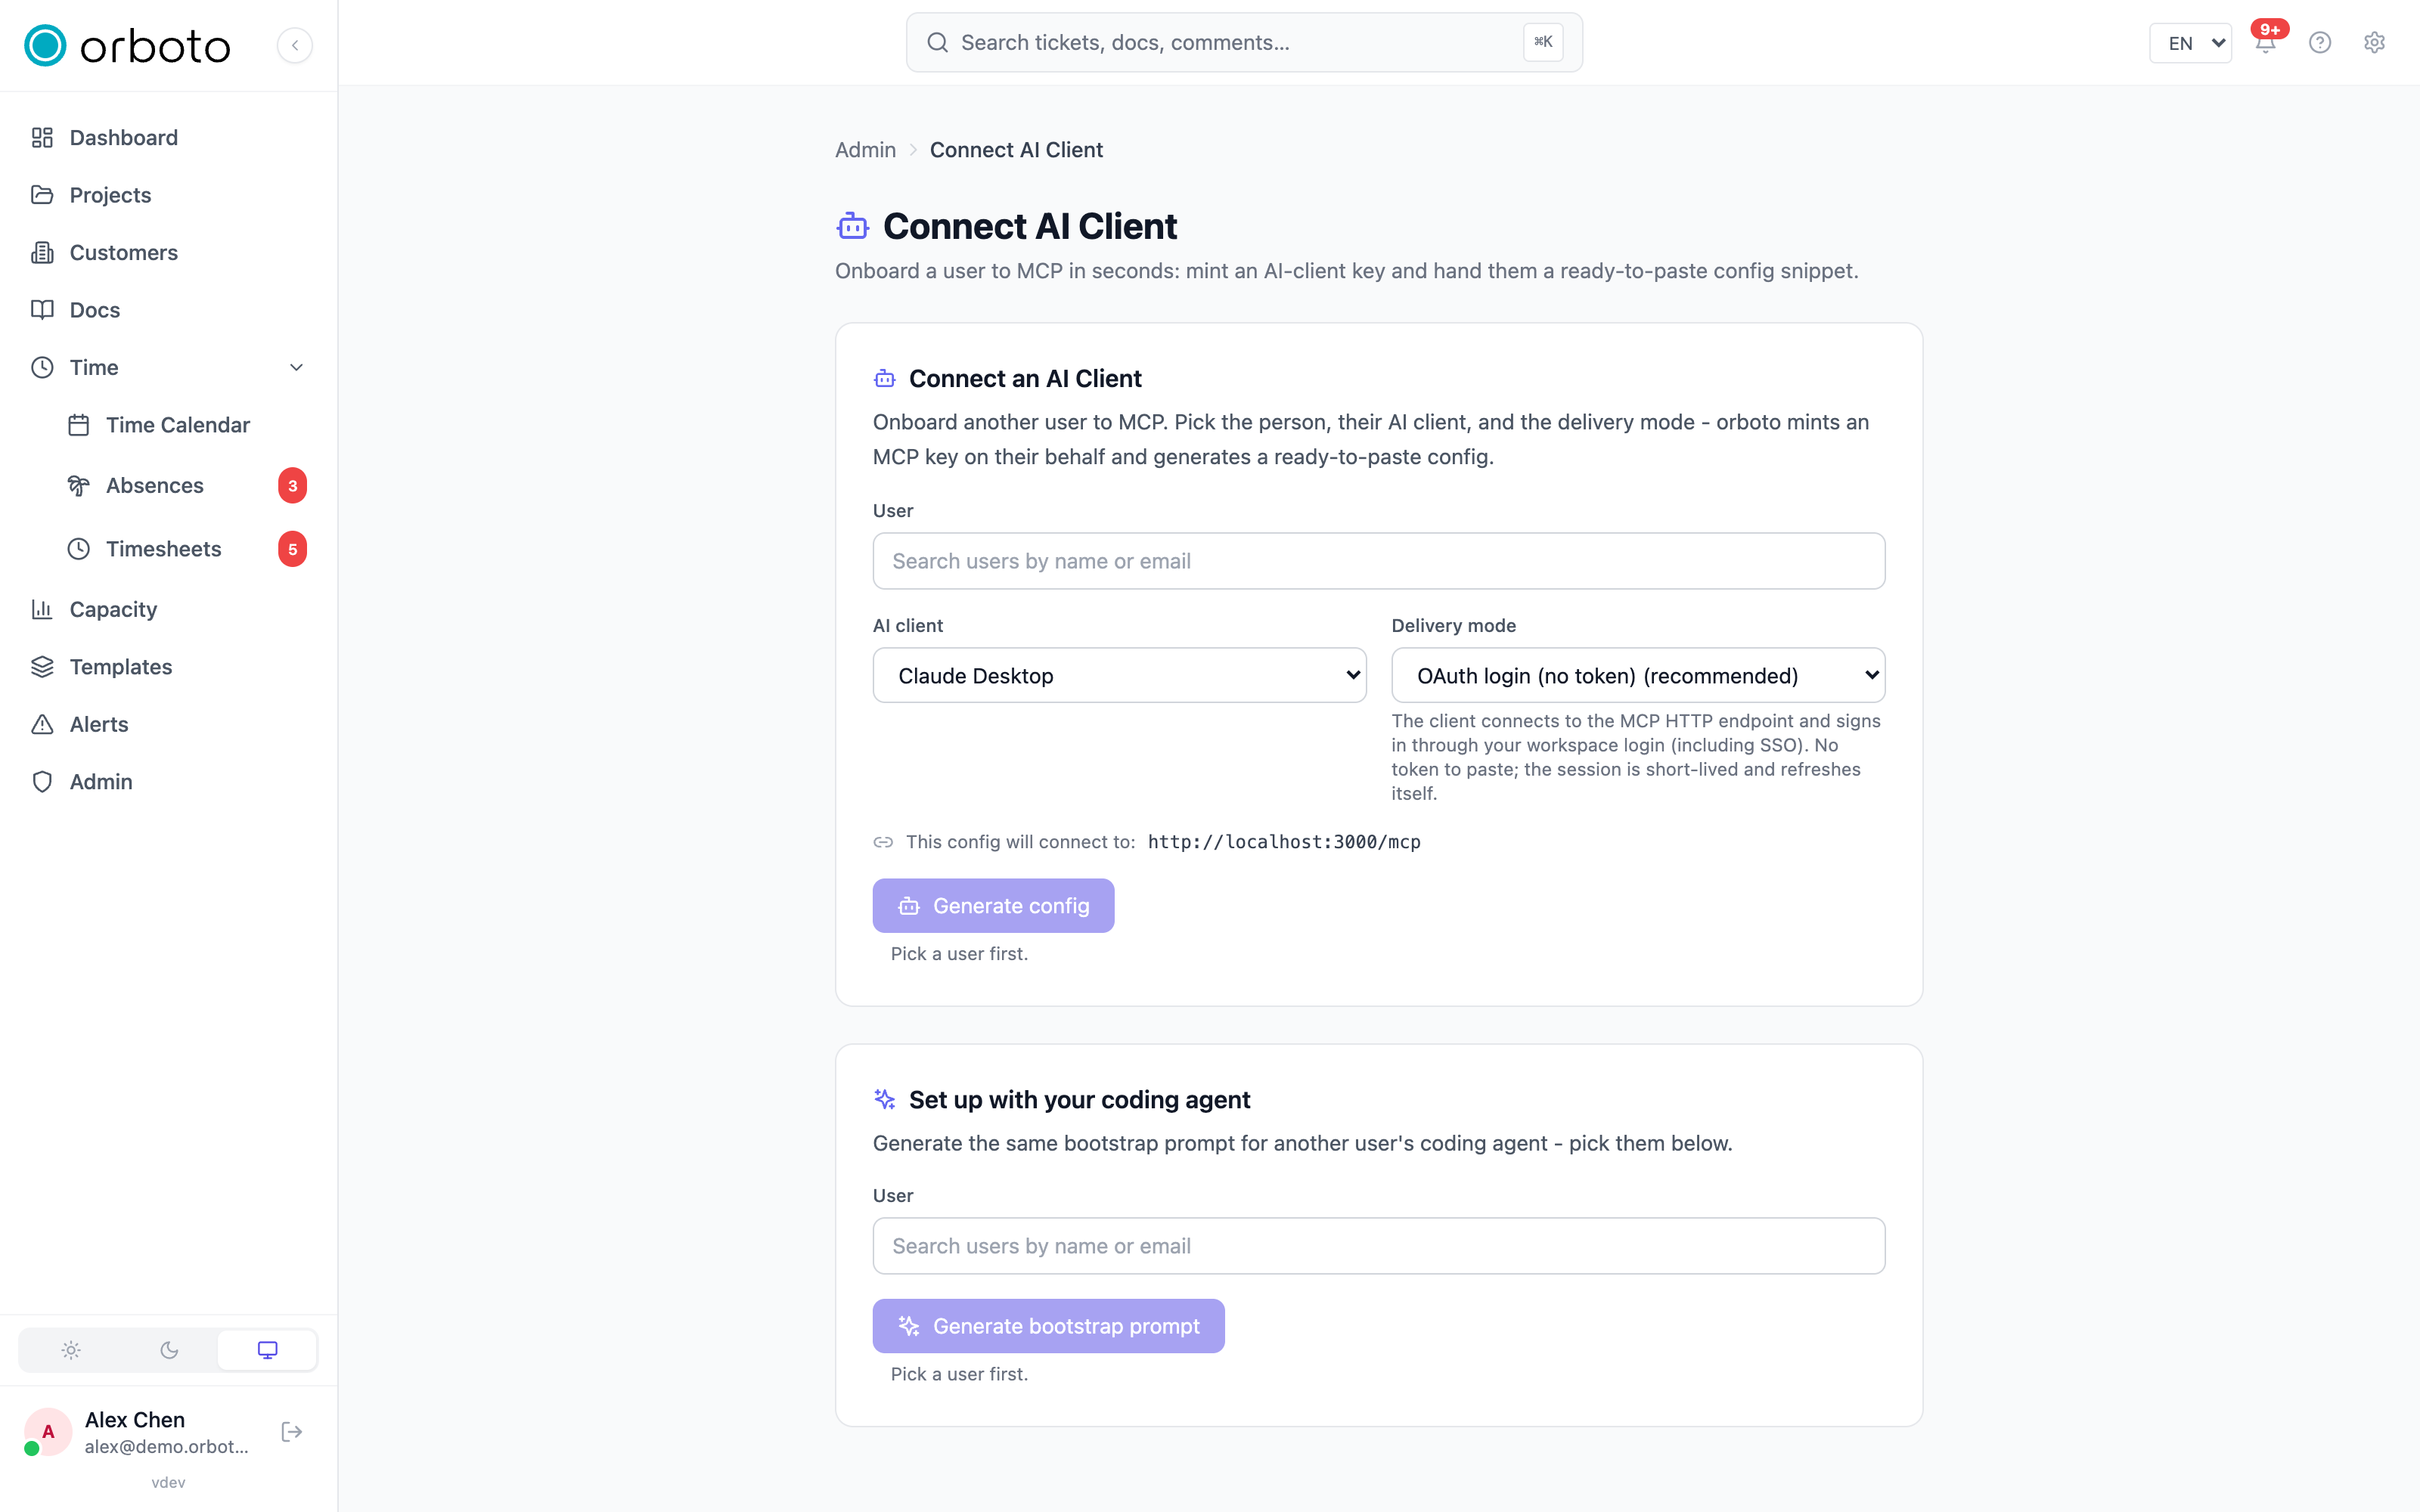
Onboard another user (Admin -> MCP setup)
Most people can set MCP up for themselves from their own Profile page, but sometimes it's faster - or necessary, for a less technical colleague or a bot account - for an admin to do it for them.
Admin -> MCP setup lets anyone holding admin:mcp:write mint an MCP
API key on behalf of another user and hand them a ready-to-paste client
configuration snippet. Pick the target user, pick which AI client
they're connecting (the snippet format differs by client), and pick a
delivery mode; the wizard generates the exact block they need to paste
into their client's configuration.
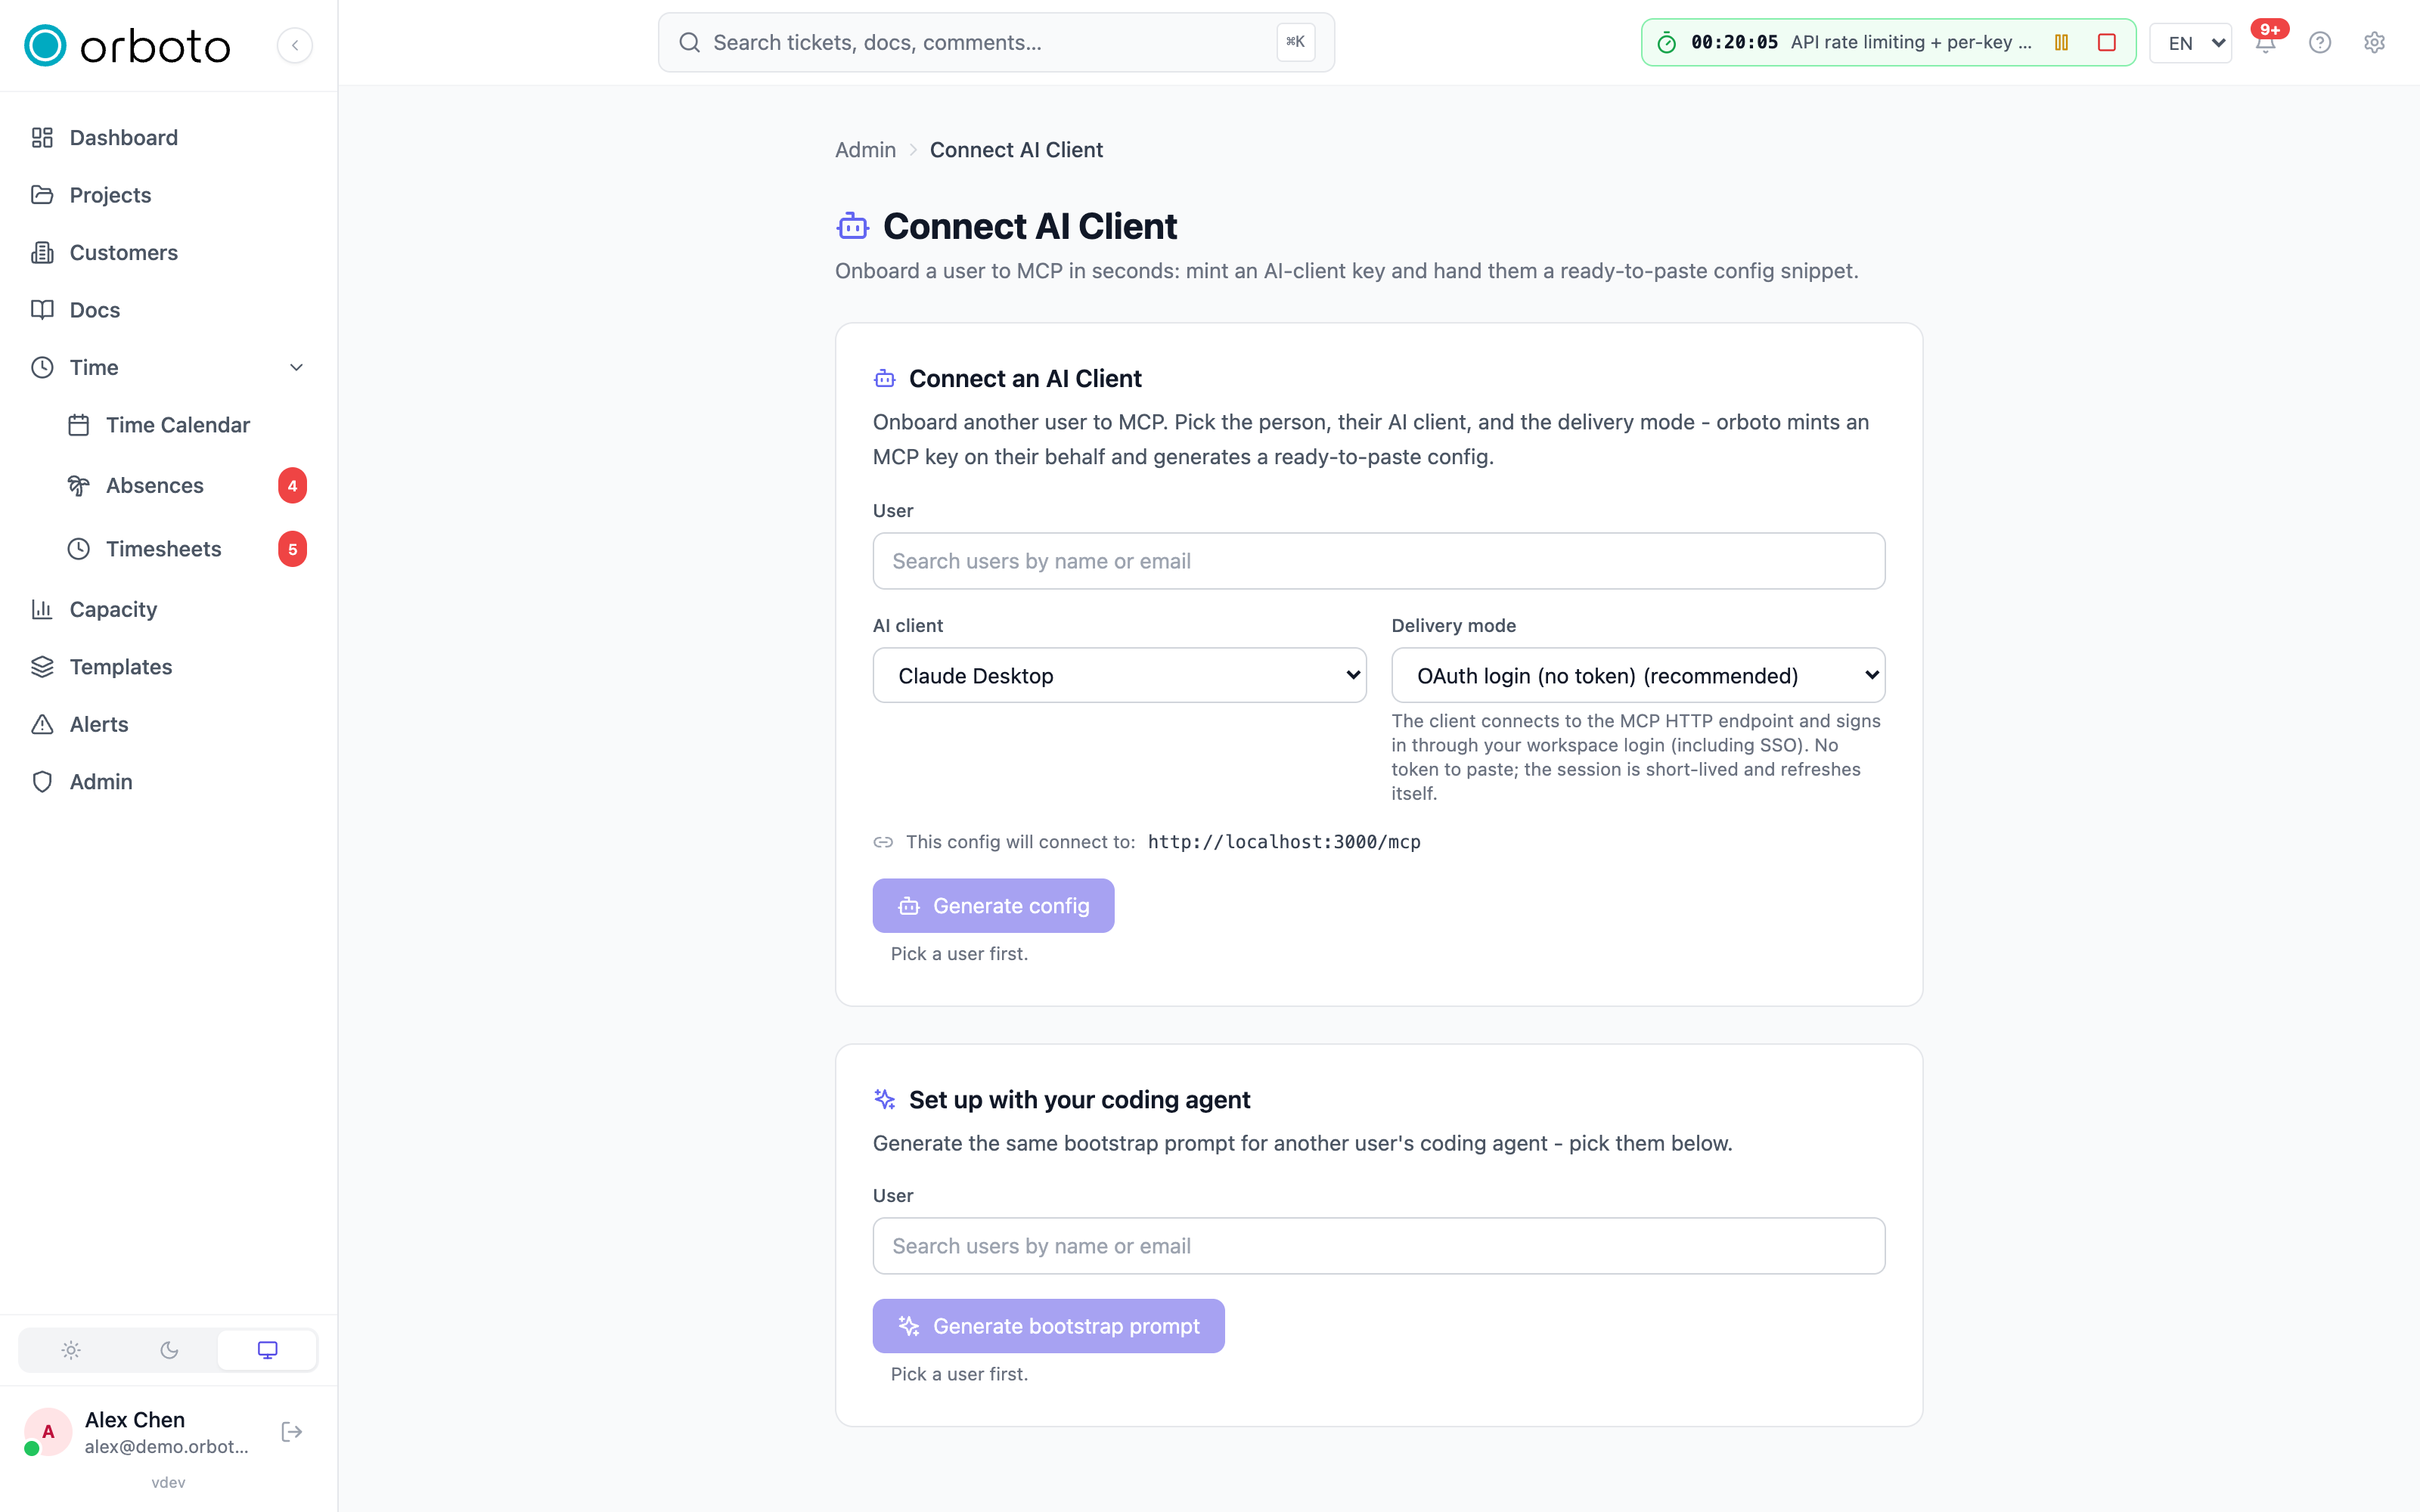
A companion "Set up with your coding agent" card on the same page covers the alternative bootstrap path for a user whose AI client can run setup commands itself rather than needing a hand-pasted config snippet.
This page also previews the workspace's current kill-switch state (below) before generating anything, so you see up front whether MCP is even reachable for the account you're about to onboard.
Usage dashboard (Admin -> MCP usage)
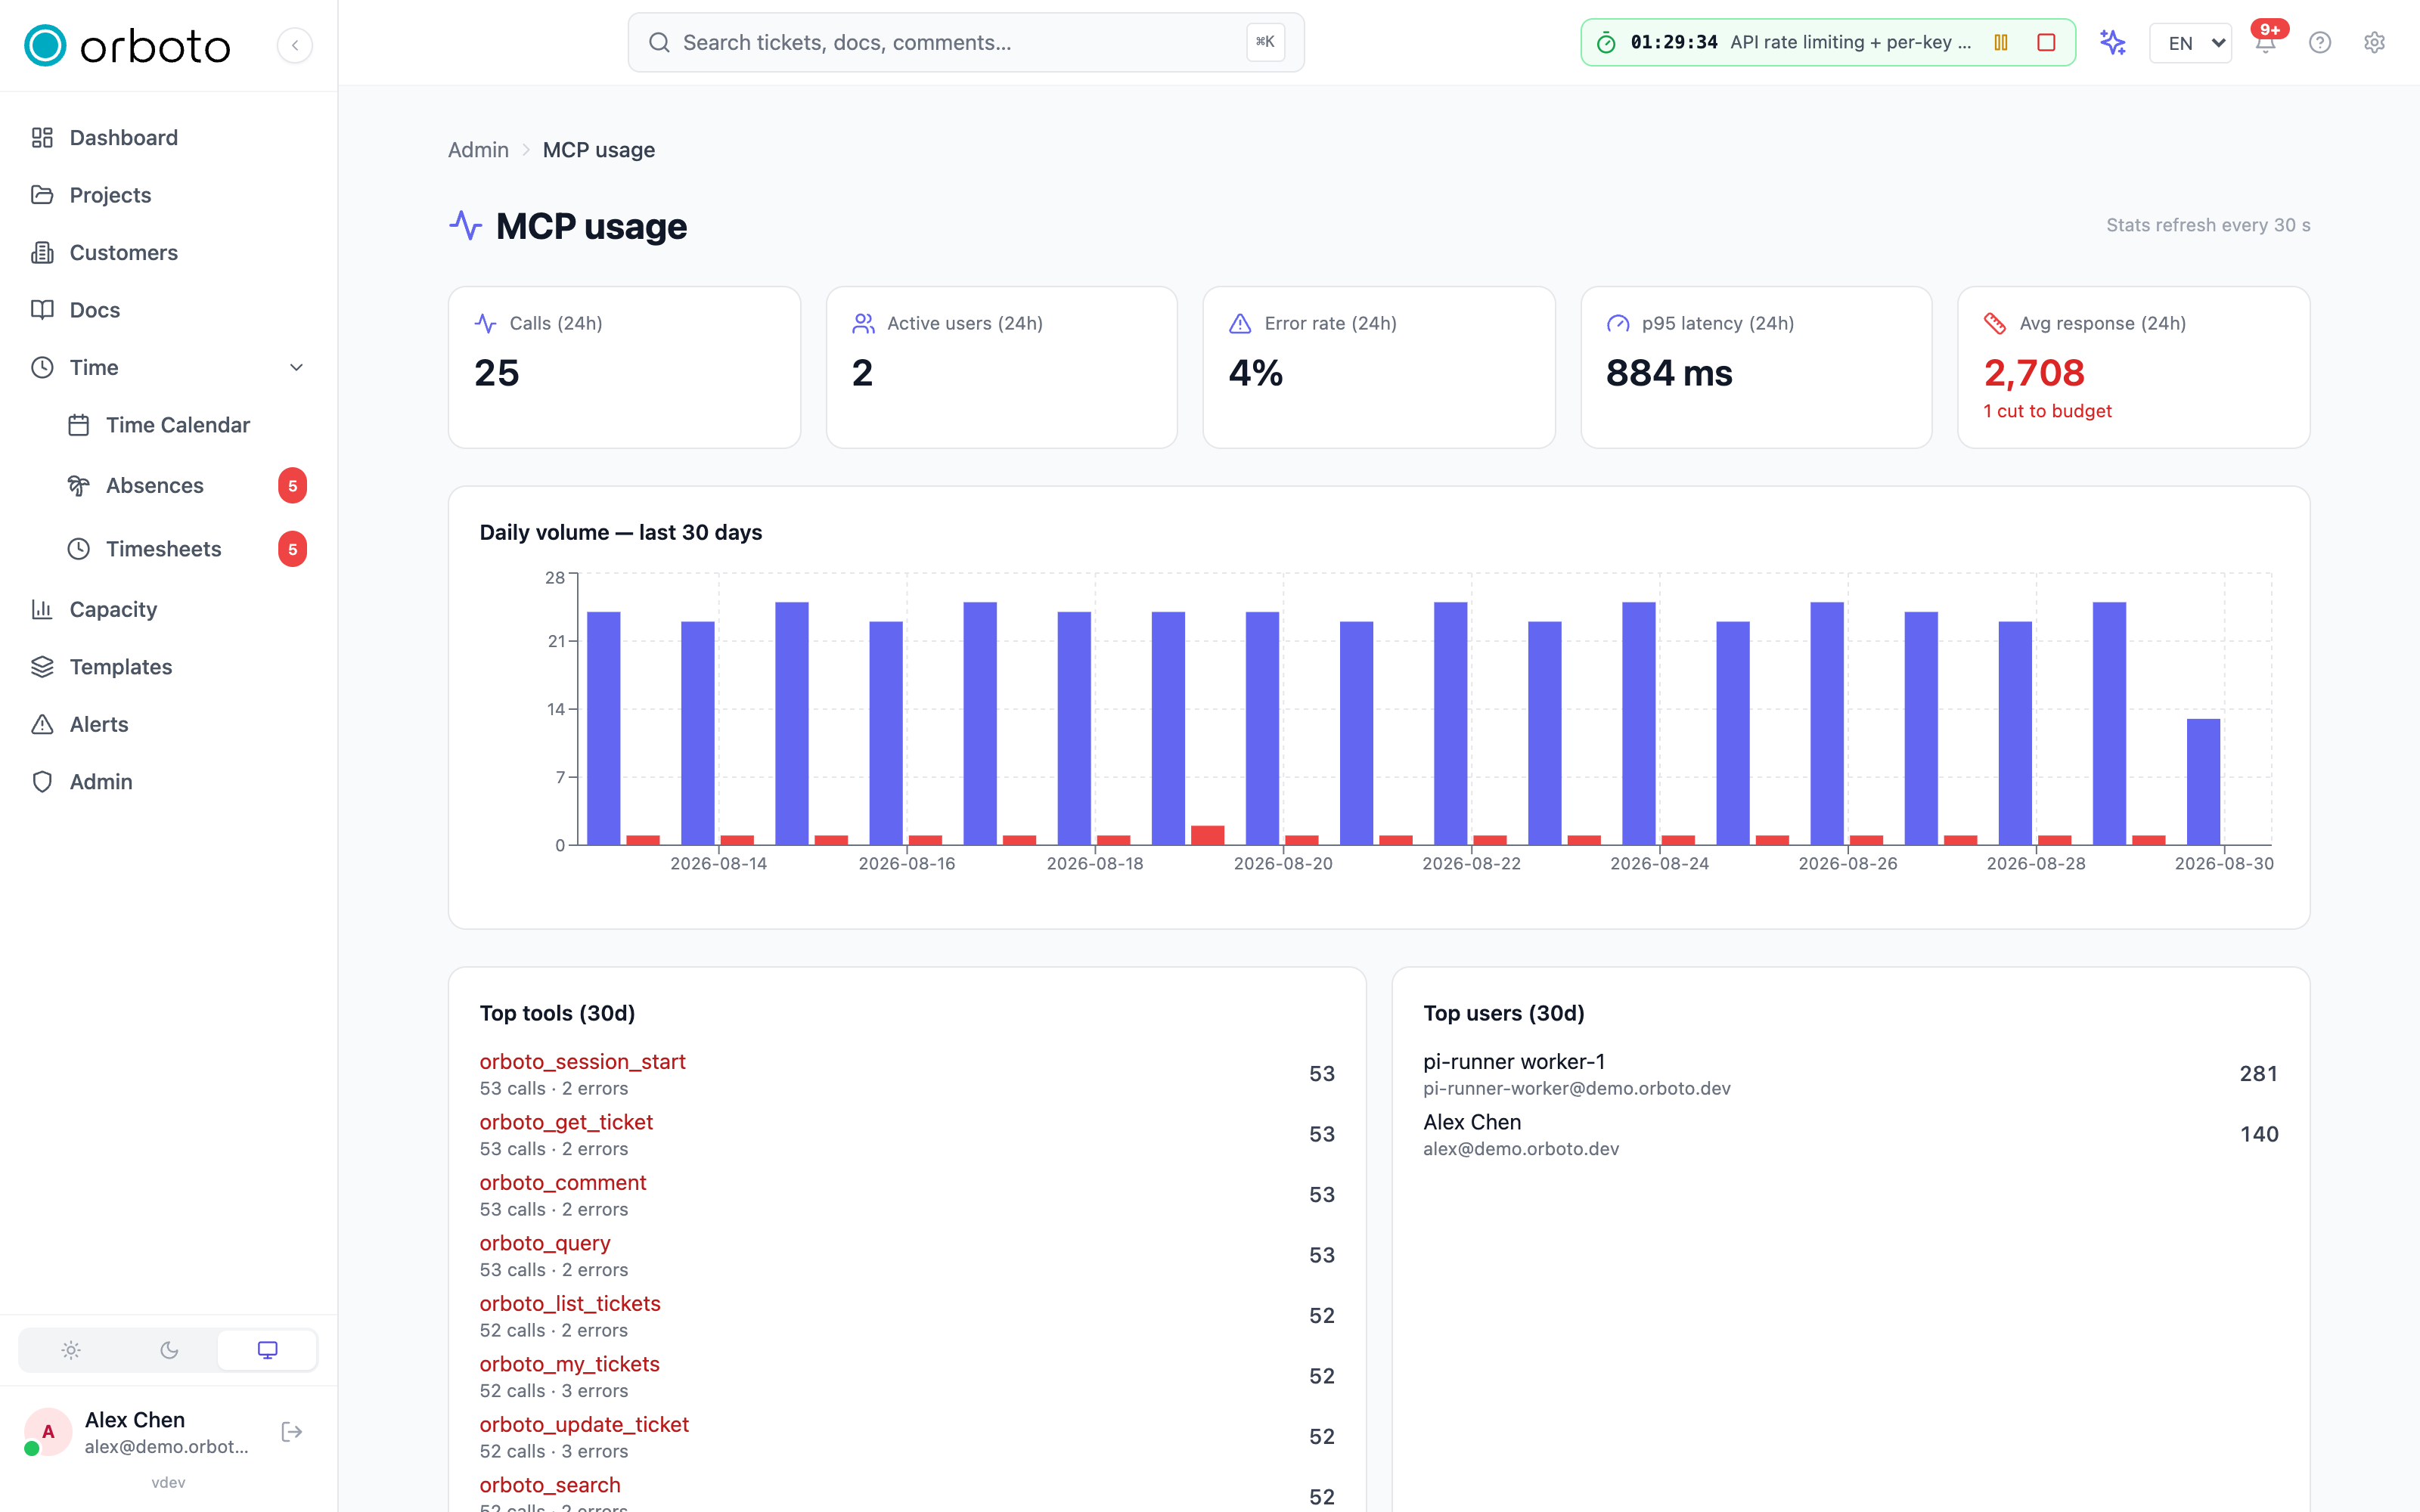
Admin -> MCP usage is the observability view: how much MCP traffic is happening, who's generating it, and where errors or oversized responses are showing up. It refreshes automatically every 30 seconds so it's usable as a live view during an incident.
KPI row
- Calls (24h) - total tool calls in the last day.
- Active users (24h) - distinct users who made at least one call.
- Error rate (24h) - percentage of calls that failed; highlighted once it crosses 5%.
- p95 latency (24h) - the 95th-percentile call duration, so a single slow outlier doesn't hide a system-wide slowdown (or vice versa).
- Avg response size - the average response payload size across calls, with a count of how many calls were cut to budget in the period (see below) when that number is non-zero.
Daily volume and top tables
A 30-day bar chart of calls vs. errors per day, plus two ranked tables: top tools (which tool names are called most, with their error counts) and top users (who's generating the most call volume).
A third table, heaviest tools by response size, exists specifically to answer "which tool should be trimmed next": every MCP tool result has a size budget (large results are explicitly cut, never silently truncated), and this table surfaces which tools are hitting that ceiling most often, sorted by average response size with a badge on any tool that's actually being cut.
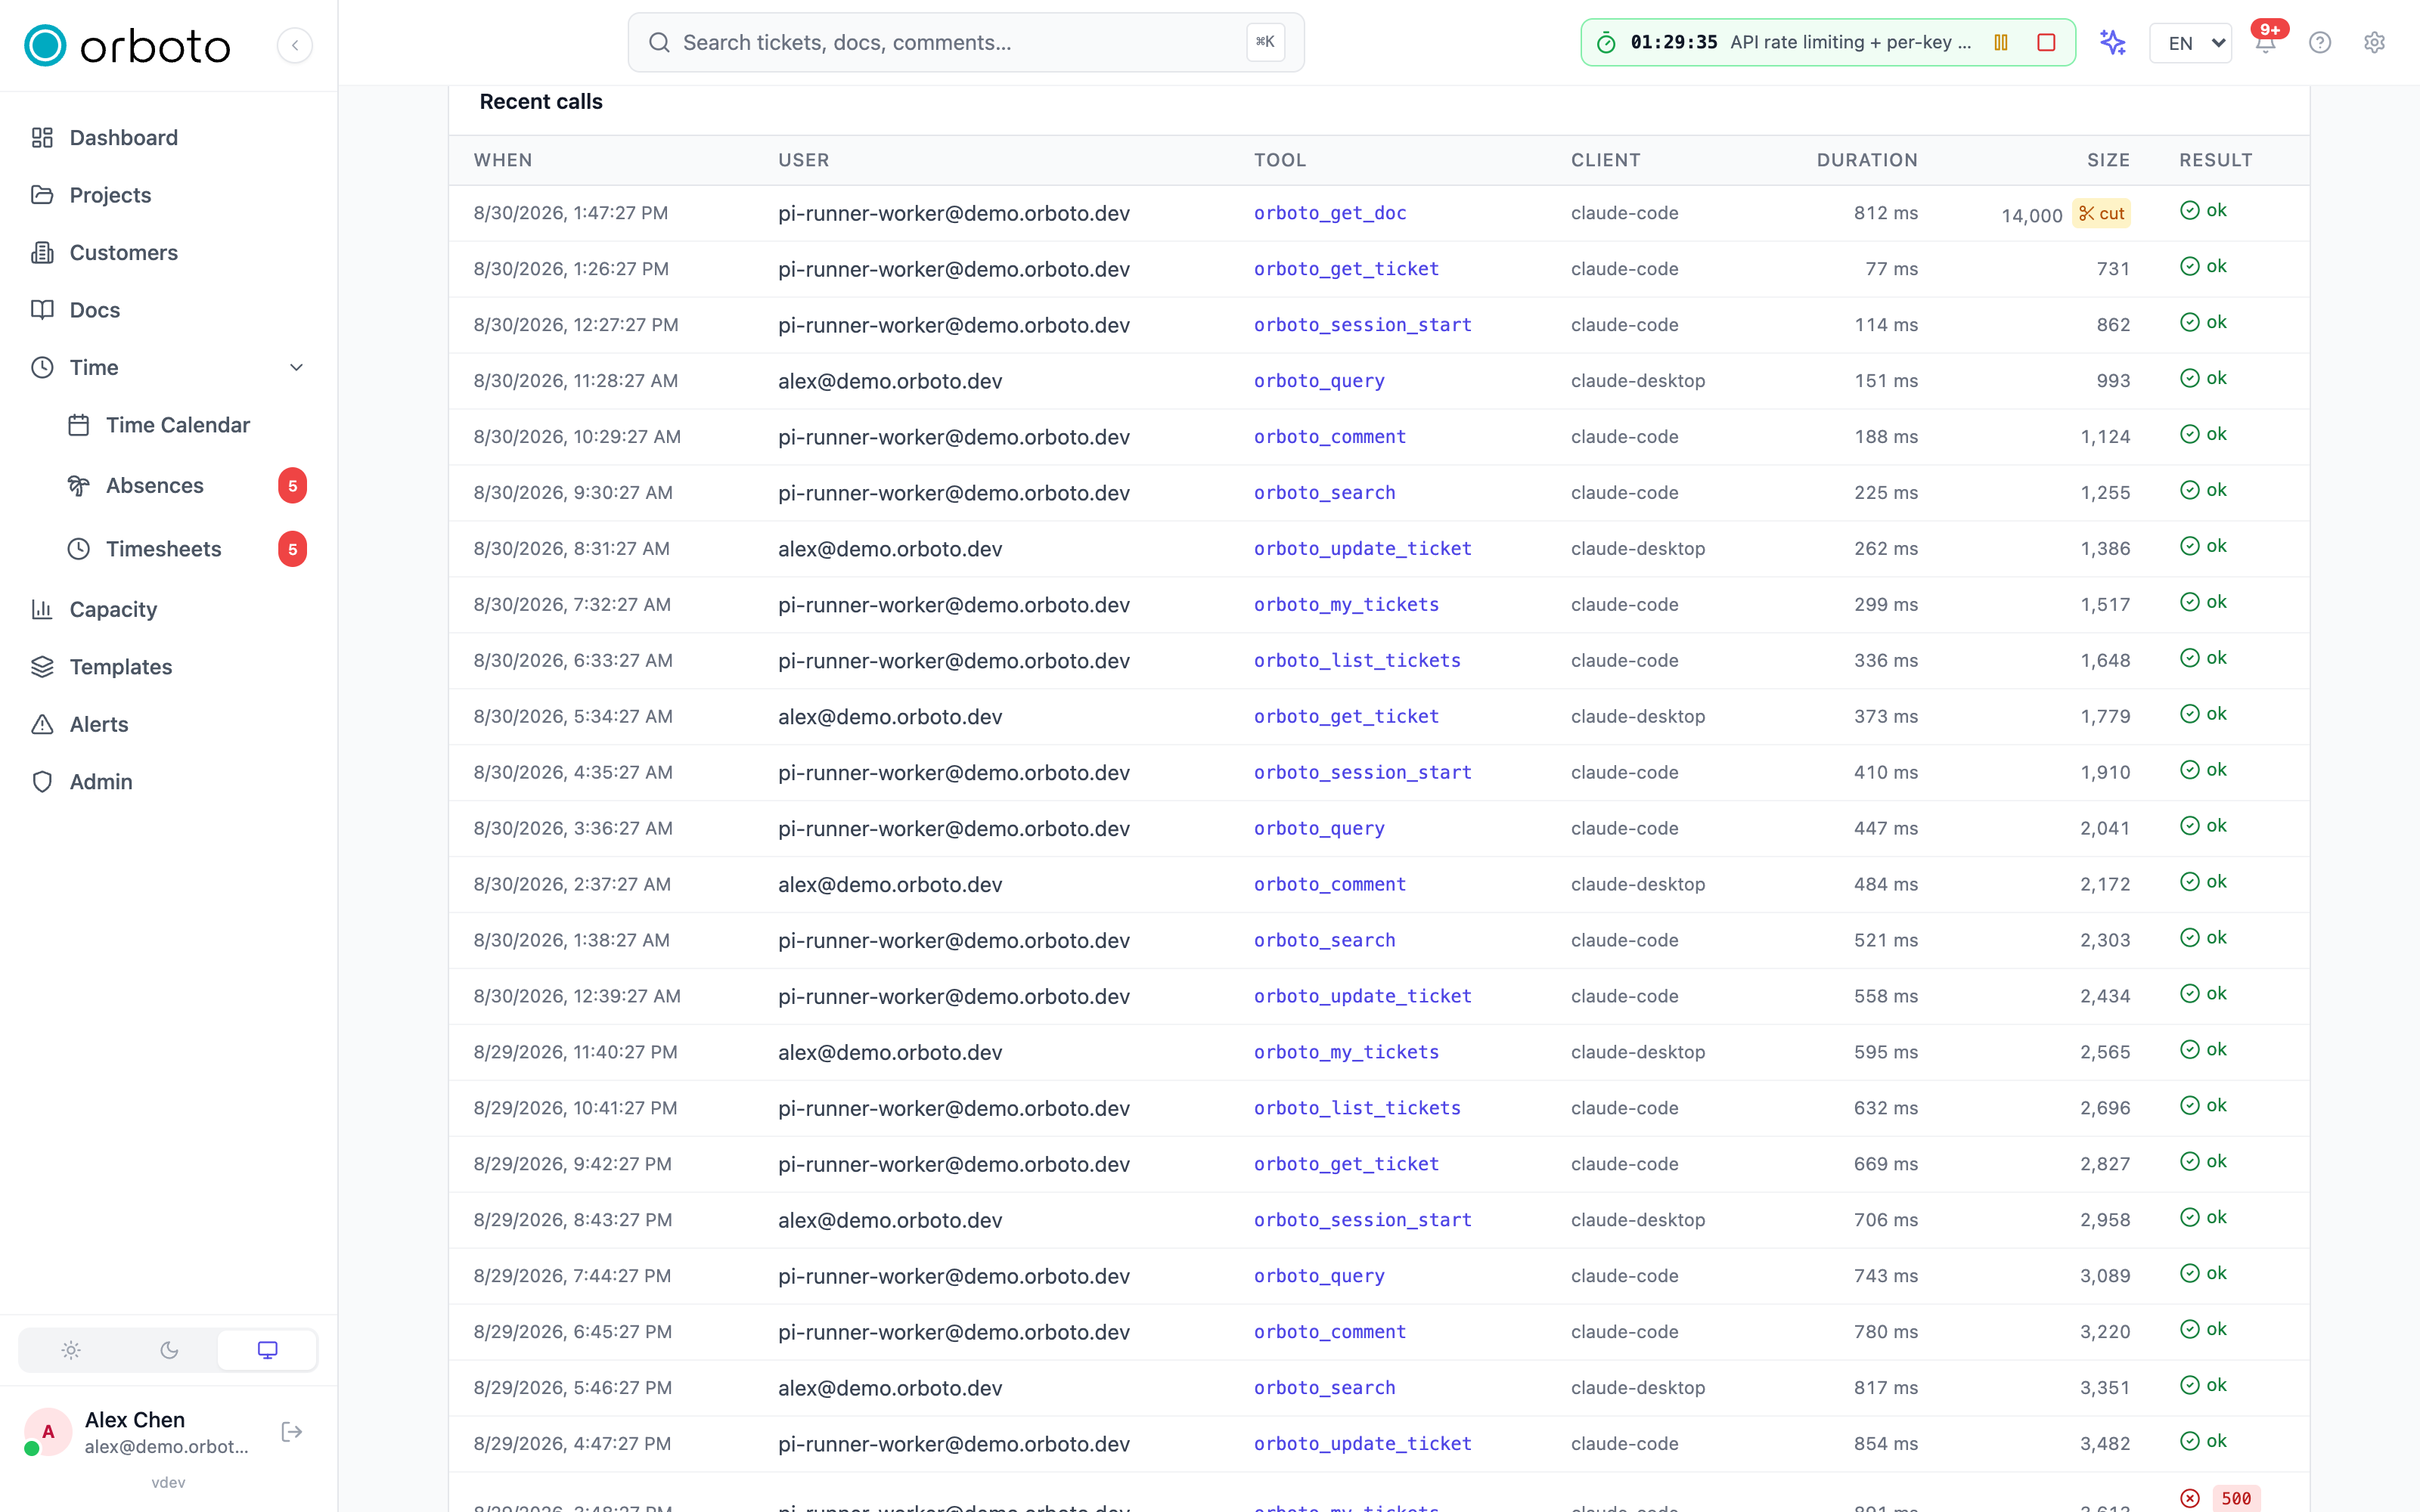
Recent calls
A live, cursor-paginated tail of individual calls: timestamp, user, tool name, which client made the call, duration, response size (with a scissors badge when that call's response was cut to budget), and the result - a green checkmark, or the HTTP status code plus the error message for a failure.
Per-call logging
Every MCP tool call your workspace processes is logged with enough detail to answer "what did this AI client actually do, and when" without needing server log access: the calling user, the tool name, the client identifier, duration, response size, success/failure, and (on failure) the status code and error message. This is what powers both the usage dashboard above and any manual audit of a specific incident - if a user reports something unexpected happened through their AI assistant, this log is where you go to see exactly which tool was called and what came back.
The kill switch
MCP server on Admin -> System settings is a single toggle that turns MCP access off for the entire workspace at once, regardless of which individual users hold the per-user MCP permission. Use it for compliance freezes, incident response, or staged rollouts where you want to disable the whole surface without touching individual user permissions.
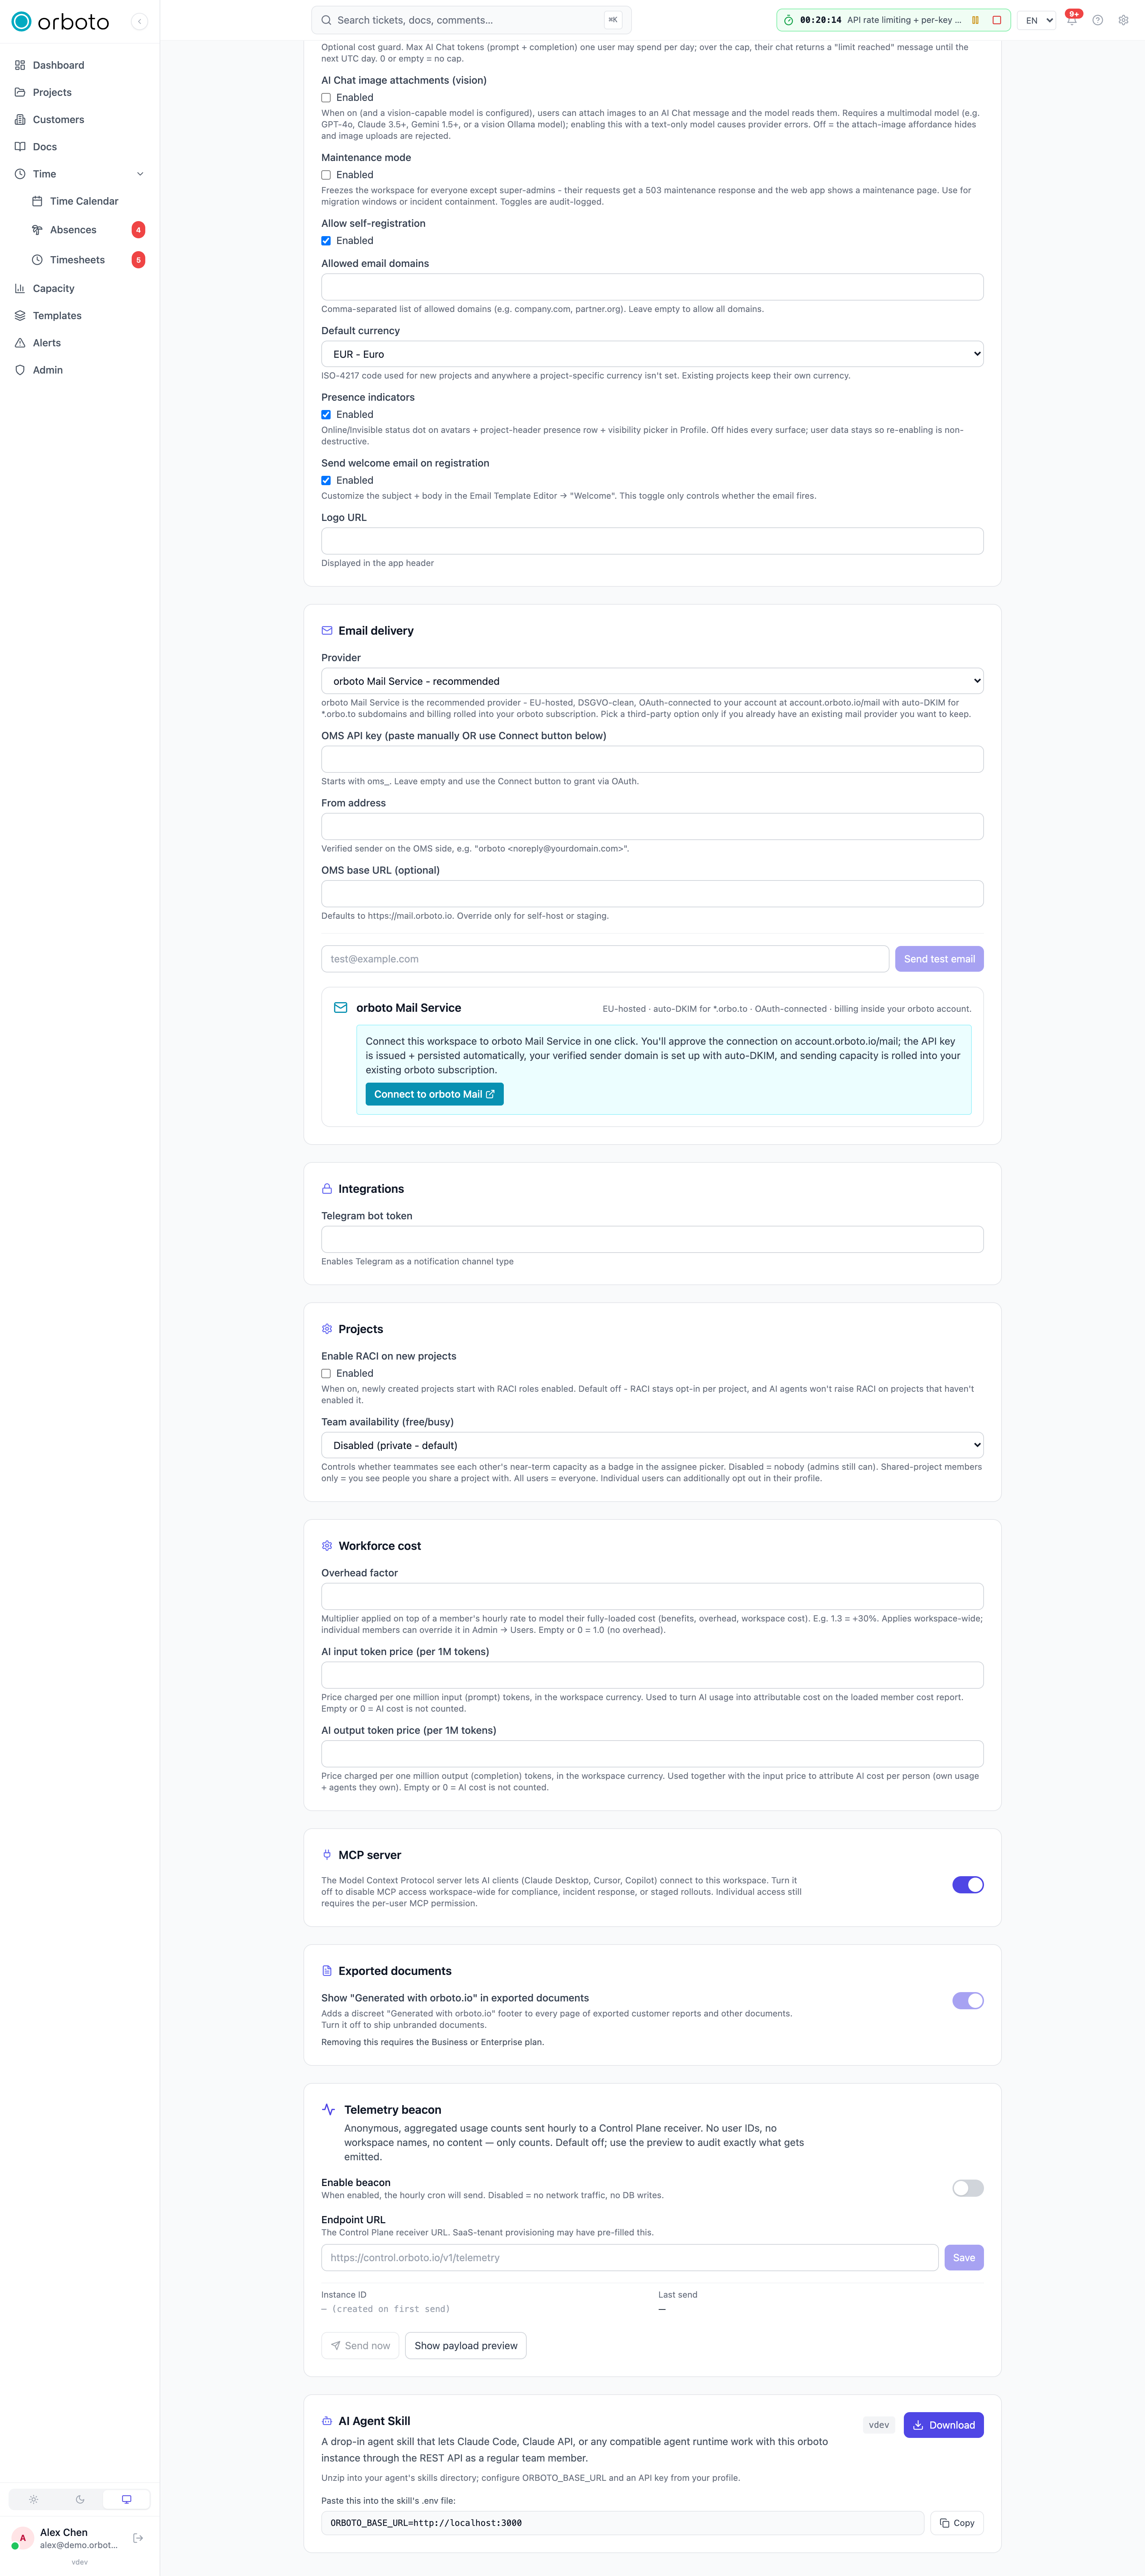
The toggle defaults to on - a fresh workspace with no explicit setting behaves as if MCP is enabled. Turning it off:
- Blocks new MCP sessions and tool calls workspace-wide.
- Refuses OAuth token renewal for existing connections, so a client that was mid-session eventually loses access as its token needs refreshing rather than being forcibly disconnected mid-call.
- Is audit-logged with the actor and the before/after state, so a flip is always traceable to who did it and when.
Individual per-user access still layers on top: even with the
workspace switch on, a specific user still needs the mcp:use
permission (via their role) to actually use MCP - the workspace switch
and the per-user permission are two independent gates, both must be
open.
Troubleshooting
- A user reports MCP tools aren't working, but the dashboard shows
calls succeeding for other users - check whether that specific
user's role grants
mcp:use; the workspace kill switch is all-or- nothing, but per-user access still depends on their own permissions. - Everyone lost MCP access at once - check Admin -> System settings -> MCP server; someone likely flipped the workspace kill switch, and the audit log names who and when.
- The usage dashboard shows a spike in errors from one tool - open Recent calls, filter by eye on that tool's rows, and read the status code and error message directly; that's usually enough to tell whether it's a permission issue (403s from one user) or something systemic (5xx across many users).
- A tool keeps showing the "cut" badge - its response is larger than the tool's size budget and is being explicitly trimmed rather than sent in full; this is intentional cost control, not a bug, but it's worth flagging if you rely on that tool's full output regularly.
- An AI client that was previously connected quietly stopped responding after I disabled MCP - expected: the kill switch refuses token renewal rather than forcing an immediate disconnect, so an active session degrades once its token needs refreshing rather than breaking mid-call.
See also
- MCP server setup - connecting a specific AI client (Claude Desktop, Cursor, Copilot, Codex), transports, and the full tool/resource/prompt surface.