

Portfolio views
Group projects into a portfolio and roll up progress, budget, and risk across all of them in one dashboard.
A portfolio is a named group of projects - a program, a customer engagement, a product line - that you build on purpose and then read as a single rollup dashboard. It is an admin-managed surface: creating and editing portfolios requires a portfolio-management permission that an administrator grants, separate from being a member of the underlying projects.
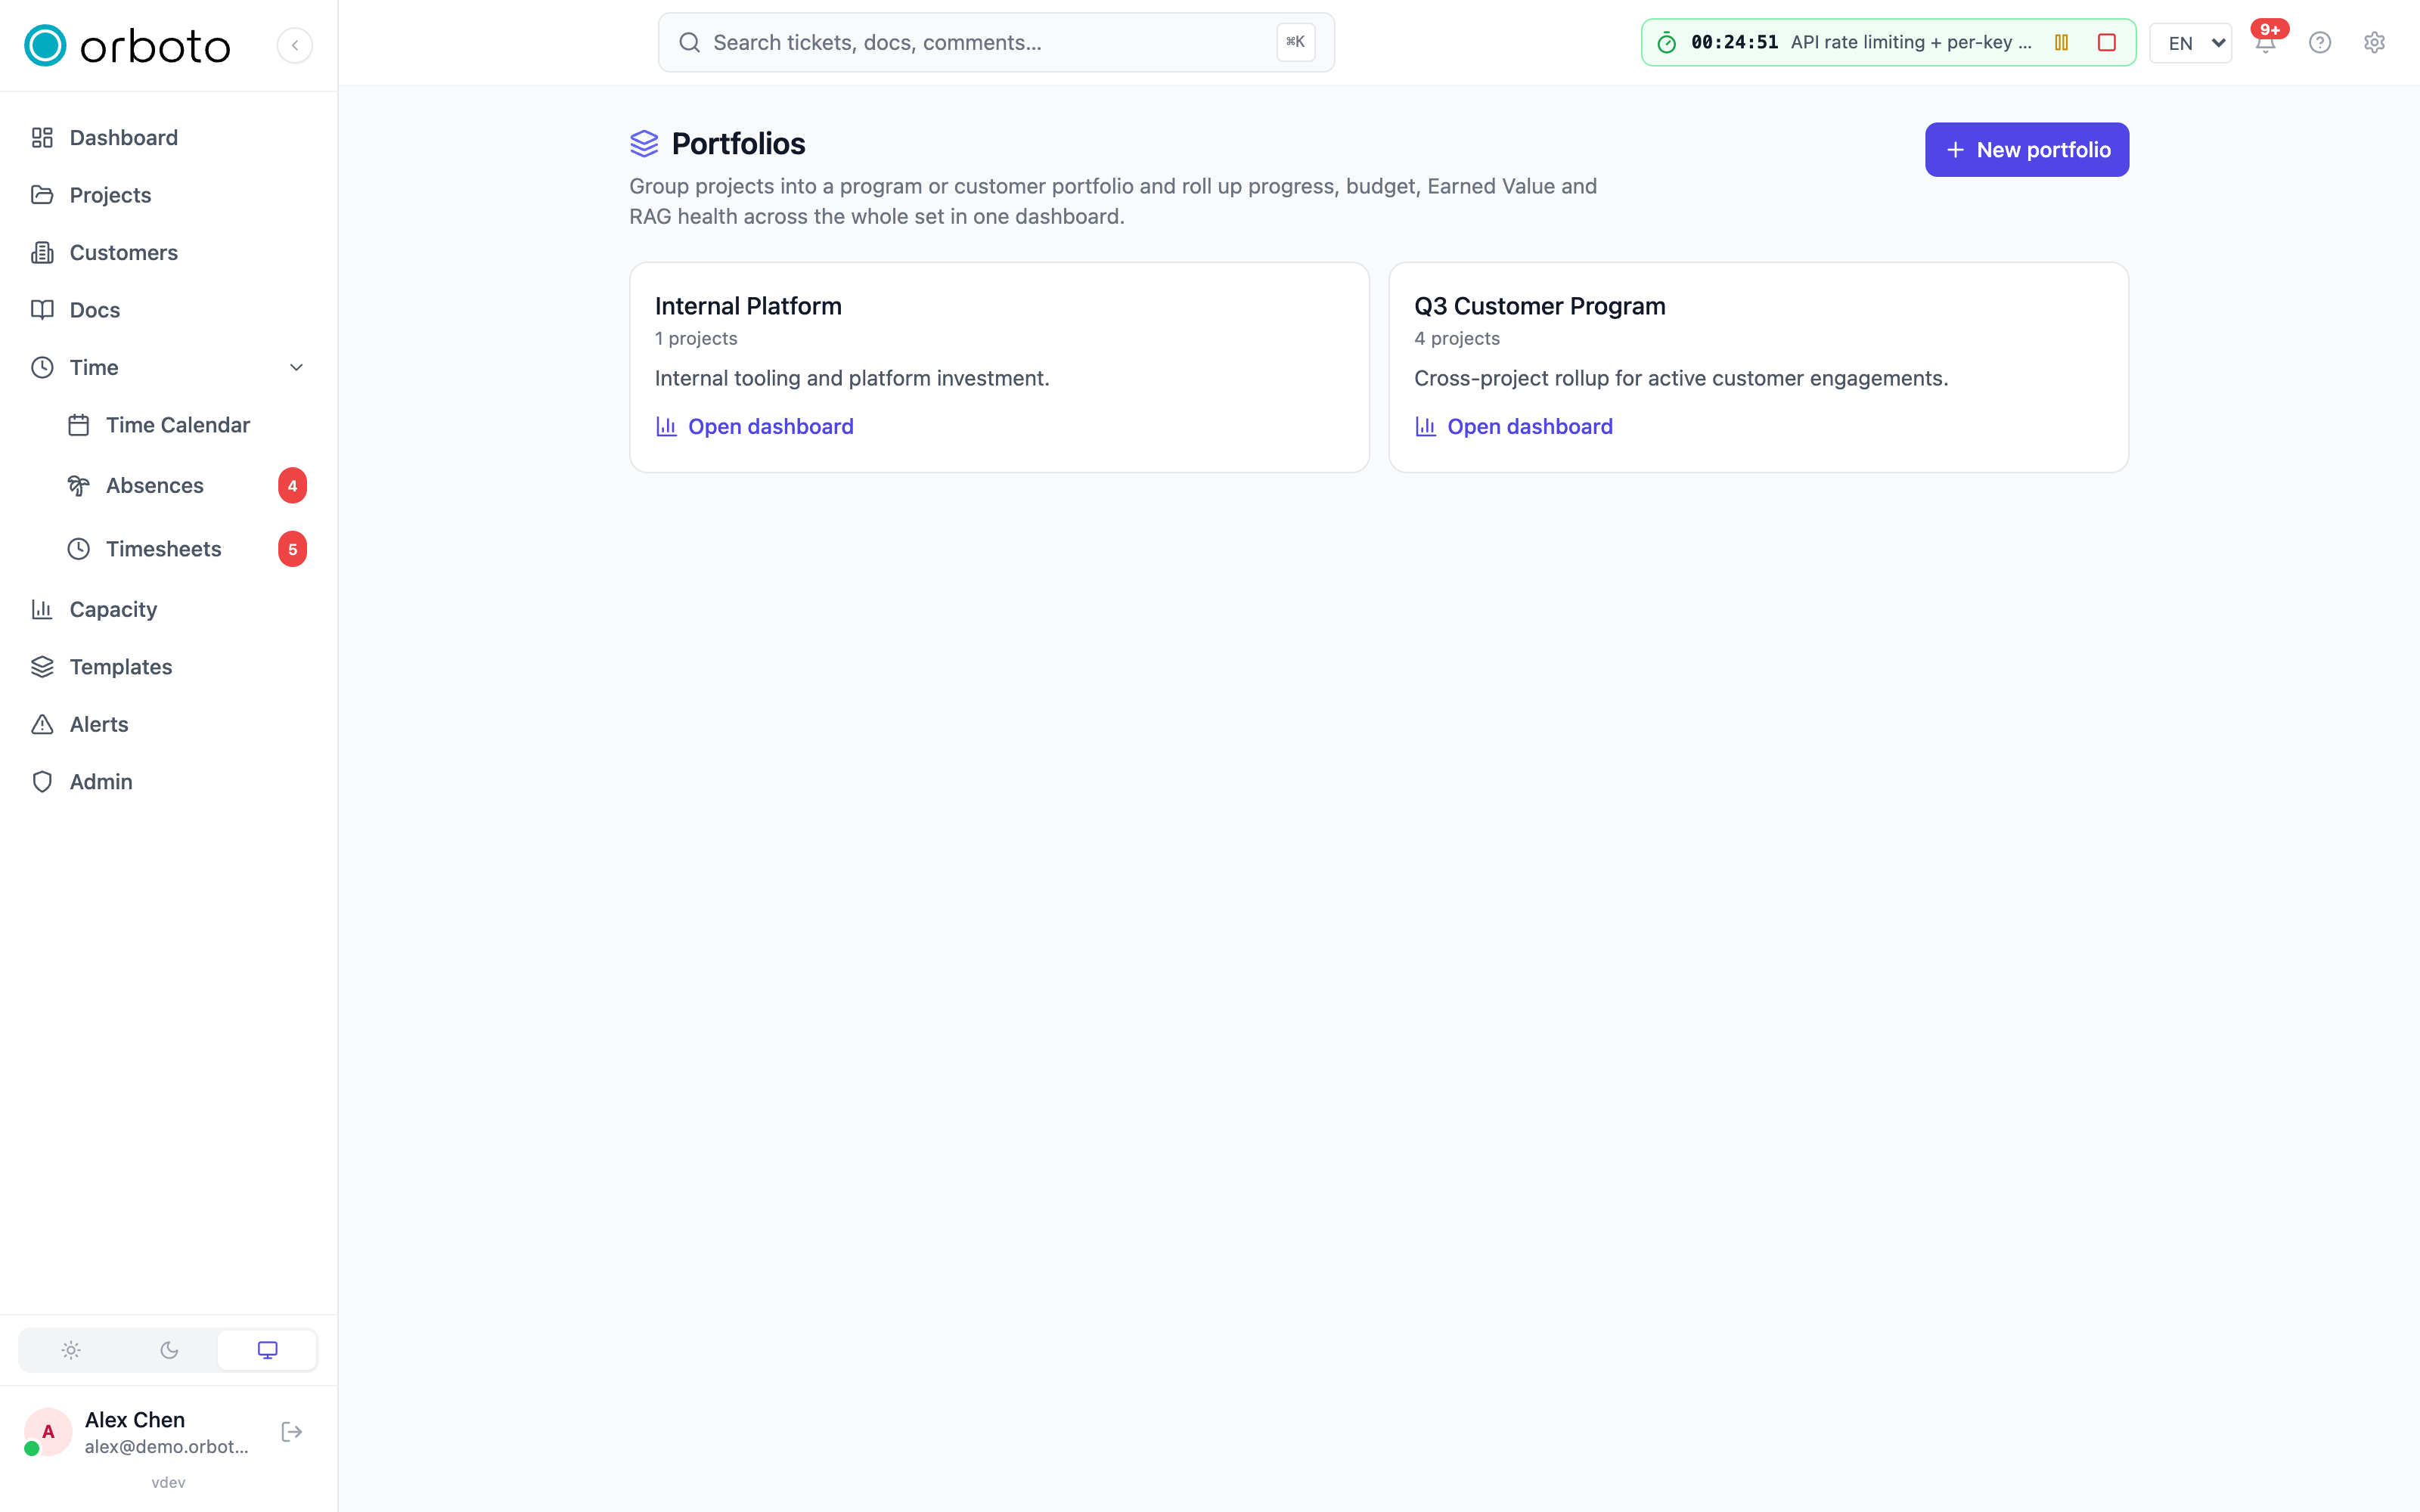
Creating a portfolio
- Open Portfolios (under the admin area).
- Select New portfolio.
- Give it a name (for example "Q3 Customer Program") and an optional description.
- Tick the projects that belong to it from the checklist. A project can belong to more than one portfolio.
- Save.
Edit a portfolio at any time to add or remove projects, or rename it. Deleting a portfolio only removes the grouping - the projects themselves, and everything in them, are untouched.
Reading the dashboard
Select Open dashboard on a portfolio card to see its rollup.
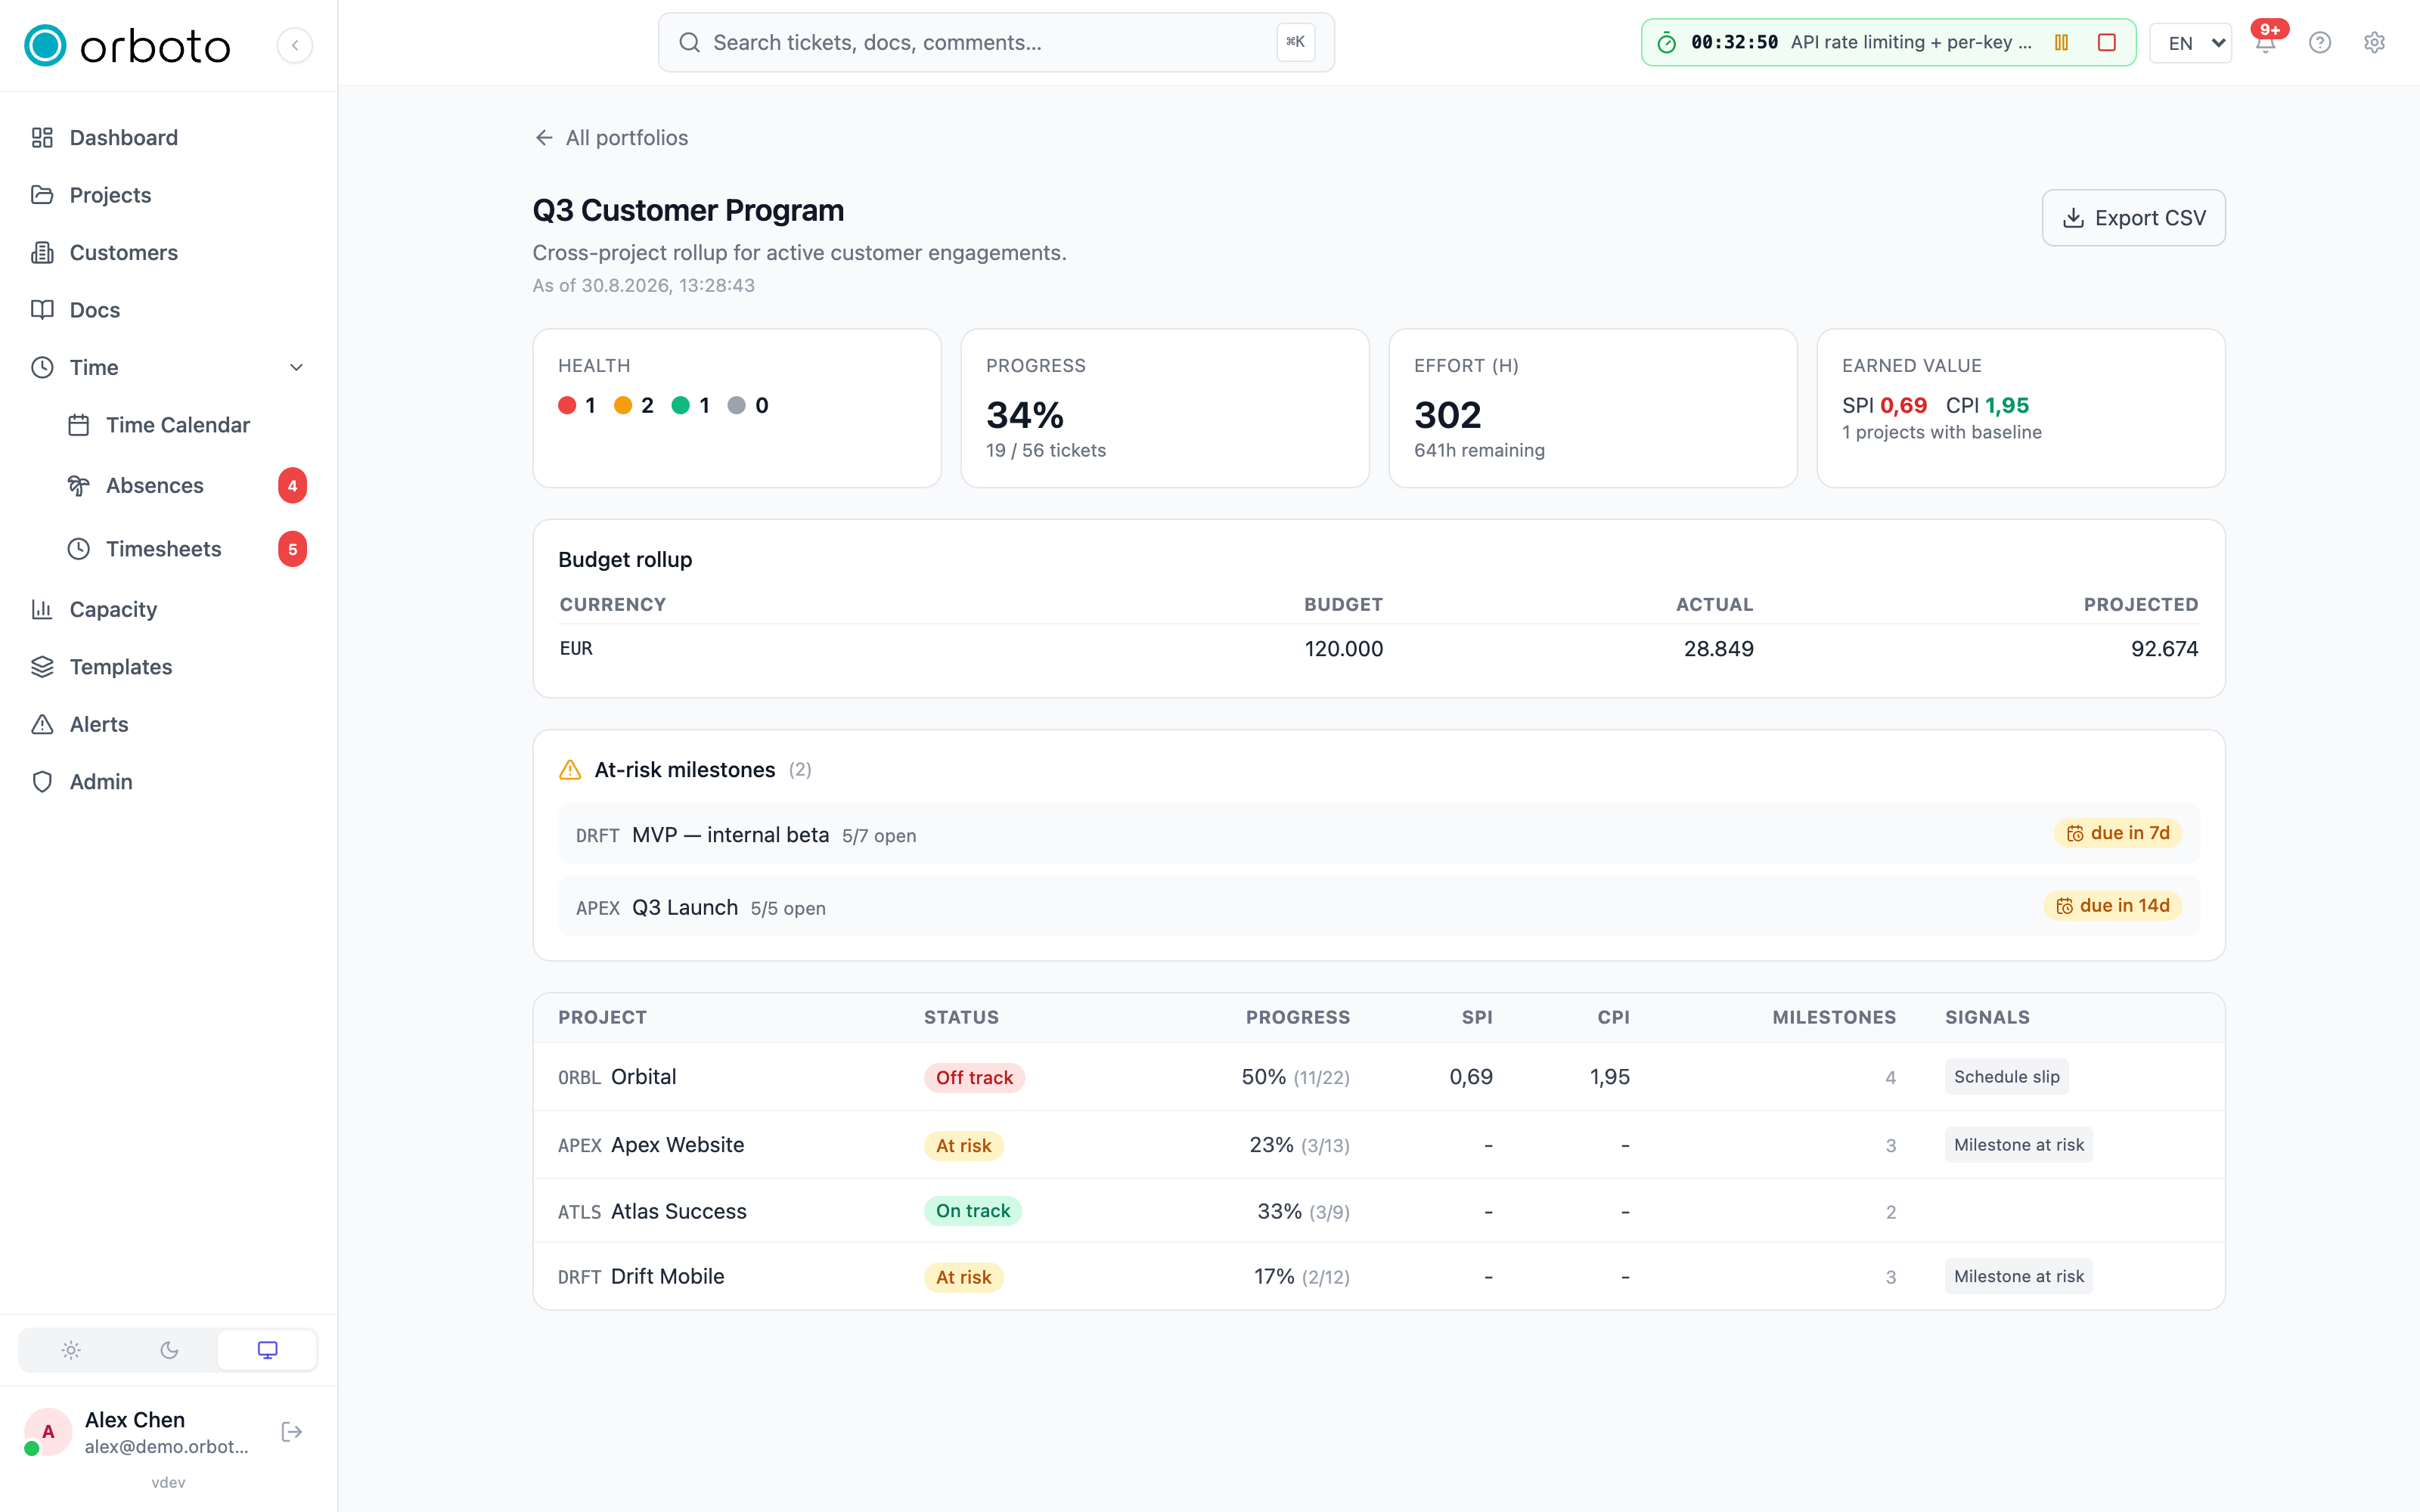
The top row of tiles summarizes the whole portfolio:
- Health - a count of projects in each RAG state: red, amber, green, or unknown (not enough data to judge).
- Progress - tickets done vs. total, across every visible project.
- Effort - hours logged so far and hours remaining, summed from ticket estimates and time entries.
- Earned Value - SPI (schedule performance index) and CPI (cost performance index) averaged across projects that have an EVM baseline set. A value under
0.95is flagged in red. Projects with no baseline are excluded and shown separately as "No EVM baseline set".
If any project in the portfolio has a budget configured, a budget rollup table breaks spend down by currency: budget, actual cost, and projected cost (projected cost is flagged when it exceeds the budget).
At-risk milestones
A dedicated panel lists every milestone across the portfolio that is either overdue or due soon, with how many of its tickets are still open. This is the fastest way to see what is about to slip before it does.

Per-project breakdown
Below the summary, a table lists every project in the portfolio with its RAG status, progress percentage, SPI, CPI, milestone counts (overdue milestones are called out), and the signals that drove its RAG rating - so a red project is never a black box.

Exporting
Use Export CSV to download the current rollup as a spreadsheet for a status report or a meeting deck.
Visibility
Every figure is filtered to the projects you are actually a member of (or can see as an administrator) - the same access rules as everywhere else in orboto. If the portfolio contains projects you cannot see, a banner tells you how many are hidden and makes clear that every number on the page only ever aggregates the ones you can. There is no separate reporting database to go stale: the dashboard reads the same live data as each project's own analytics.
Troubleshooting
I don't see Portfolios in the admin area. Creating and viewing portfolios needs a permission an administrator grants (separate from project membership). Ask an administrator to grant it if you manage cross-project reporting.
A project I expect is missing from the rollup. Either it was never added to the portfolio (edit the portfolio and tick it), or you are not a member of it - check the hidden-projects banner at the top of the dashboard.
Earned Value shows "No EVM baseline set". SPI/CPI need a budget baseline configured on the project first; see Analytics for setting one up.